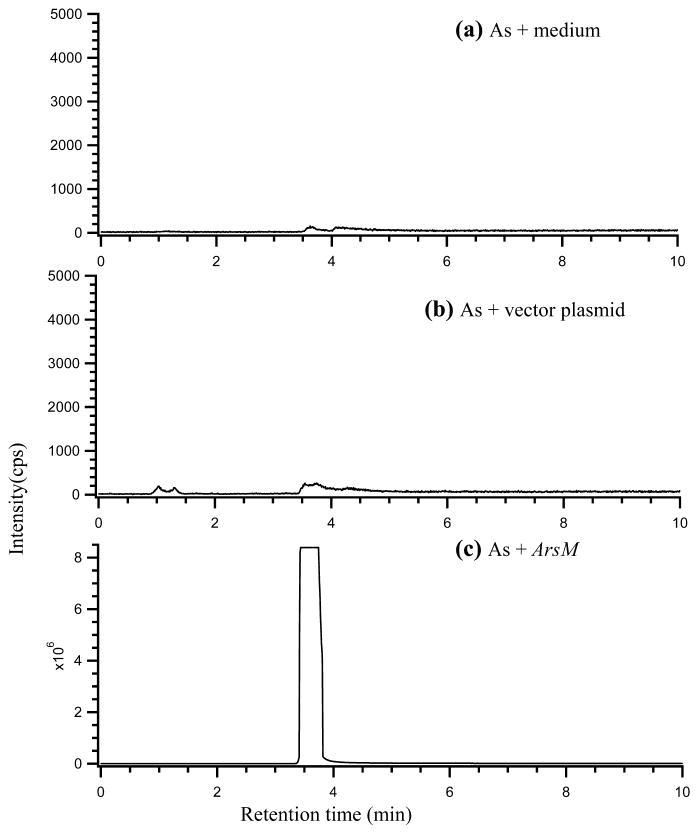
FIGURE 2.
Chromatograms from the analyses of arsenic in the headspace of bacterial cultures and control. (a) arsenite (10 μM) incubated in culture medium without E. coli cells; (b) E. coli expressing the pET-28a vector plasmid, incubated with 10 μM arsenite; (c) E. coli expressing the arsM gene, incubated with 10 μM arsenite. The major peak in (c) corresponds to (CH3)3As.

