
Figure 4.
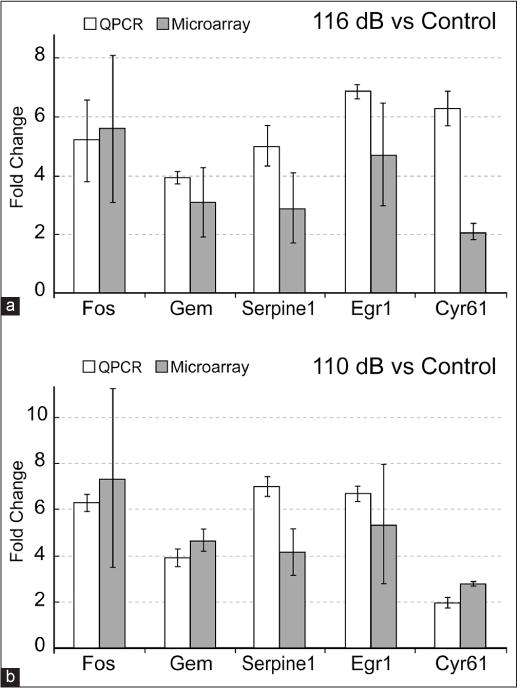
Comparison between microarray and real time polymerase chain reaction (PCR) results for selected genes. To verify the relative fold-changes (FCs) observed in the microarray analysis, total RNA recovered from each exposure group was used in real-time PCR (qPCR) analyses. Selected genes were evaluated for consistent up- or down-regulation. Relative FCs for each of the three different comparisons are as shown: (a) 116 dB SPL versus control, (b) 110 dB SPL versus control. qPCR assays were run in triplicate