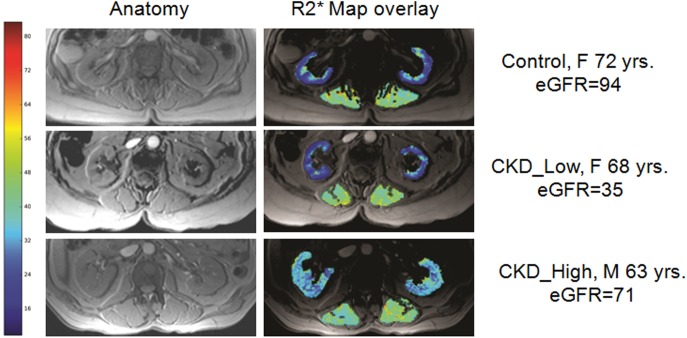
Fig 2. illustrates anatomic MRI and R2* maps from a representative subject from control, CKD_Low and CKD_High R2* groups.
The R2* maps of the kidneys are overlaid on the anatomic image and the color bar indicates high levels of hypoxia in red and progressively lower values with orange, yellow, green and blue. Note R2* values are low in the cortex of both the control and subject with CKD even though the eGFR values are significantly different, while the subject with CKD_High clearly shows higher R2* values, even though his/her eGFR values are high and comparable to the control subject. We have also included R2* values for muscle to rule out any systematic bias in R2* values in CKD_High.

