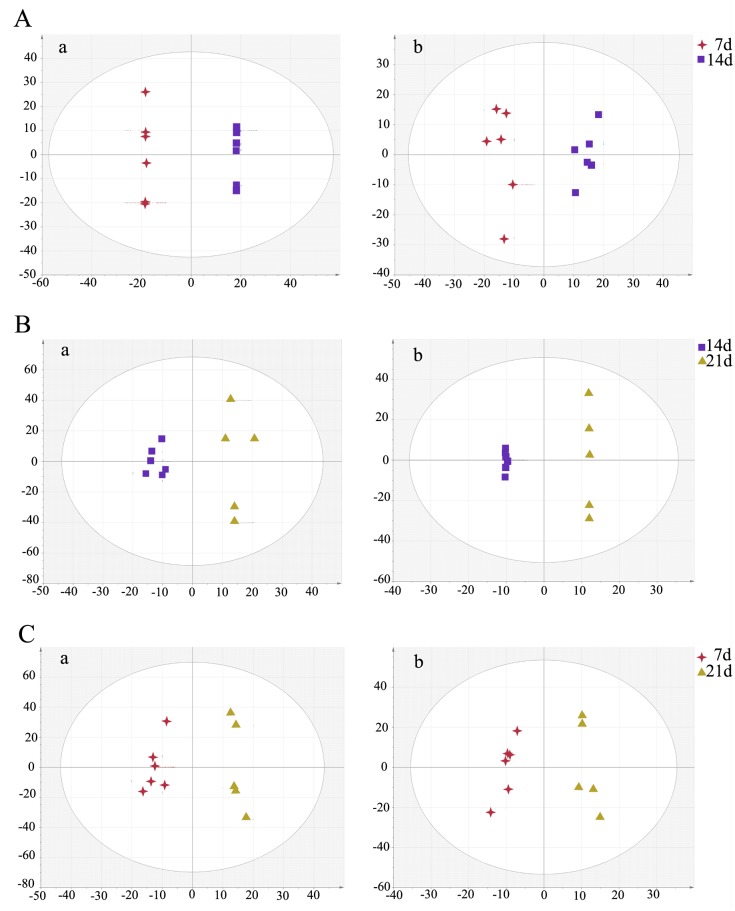
Fig 5. OPLS-DA score plot showed a clear separation between the infected brain samples at different time points.
(A) The 7 day group and the 14 day group; (B) The 21 day group and the 14 day group; (C) The 21 day group and the 7 day group. In OPLS-DA score plot, each data point represents one mouse brain sample, and the distance between points in the plot indicates the similarity between samples. a. ESI+, b. ESI-. X axis is PC1, y axis is PC2.

