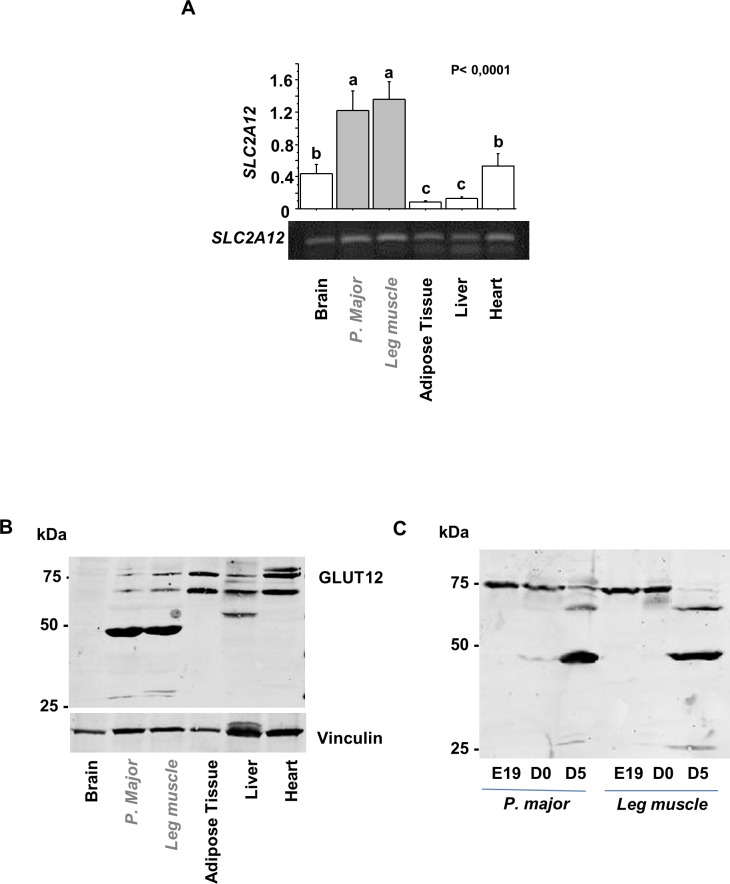
Fig 6. Tissue expression pattern of GLUT12 in the chicken.
(A) Tissues from fed chickens were analysed for SLC12A12 expression by Real-Time PCR (N = 6). Values represent means and standard errors. Data were subjected to analysis of variance (ANOVA) to detect significant intergroup differences. Statistical model was tissue comparison. The means were compared by Fisher’s least significant difference test. P<0.05 was considered statistically significant. (B) Tissues from fed chickens were analysed by Western blotting using an anti-GLUT12 antibody for protein distribution analyses (N = 5). In grey: skeletal muscles (Pectoralis major and leg muscle). Vinculin was used as a protein loading control. (C) Protein distribution was analysed from Pectoralis major and the leg muscles, collected at 19 days during embryogenesis, hatch and 5 days post-hatch. (N = 7).

