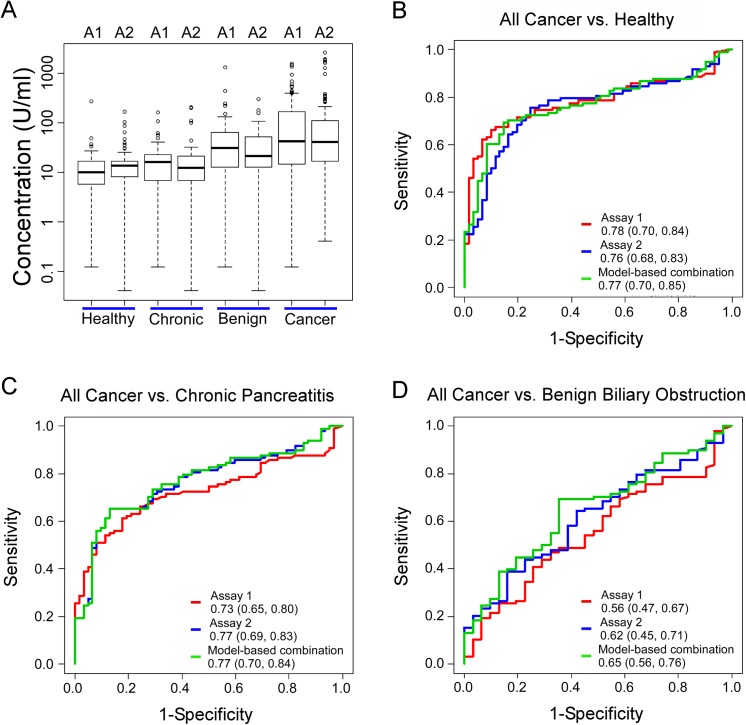
Fig 1. Differentiating pancreatic cancer from control subjects by two different CA 19–9 assays.
A) CA 19–9 levels in each group. We present the log-transformed values to better visualize all ranges of the values. The boxes indicate the quartiles of the distributions, the horizontal lines in the boxes indicate the medians, and the dashed lines give the ranges, with individual outliers indicated by the circles. A1, Assay 1; A2, Assay 2. B-D) Receiver-operator-characteristic (ROC) curves comparing all pancreatic cancer patients to the indicated control groups. The legends specify the area-under-the-curves (AUCs) for each assay, with the ranges of the 95% confidence intervals.

