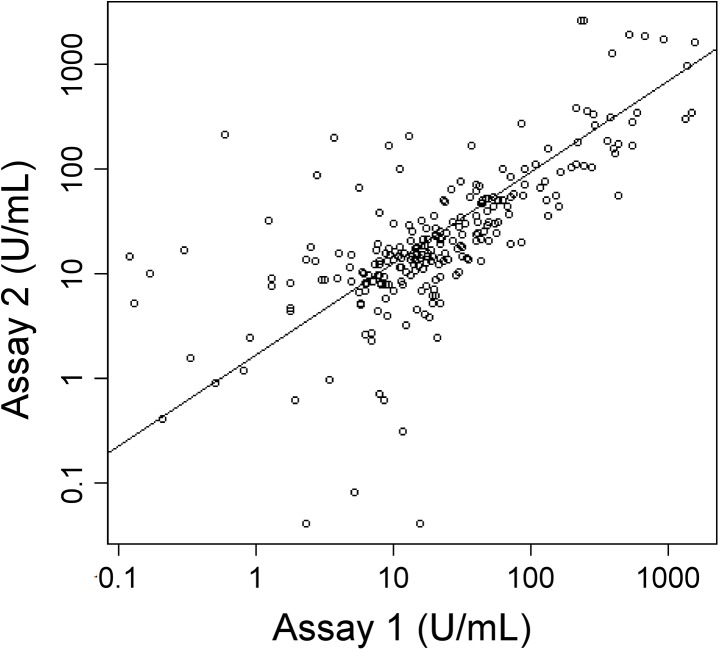
Fig 2. Correlation between Assay 1 and Assay 2.
The log-transformed CA 19–9 values of all subjects from Assay 1 and Assay 2 were plotted with respect to each other. Each circle indicates an individual patient sample. The trendline is the linear-least squares best fit, and the Spearman’s rank correlation coefficient is 0.74.

