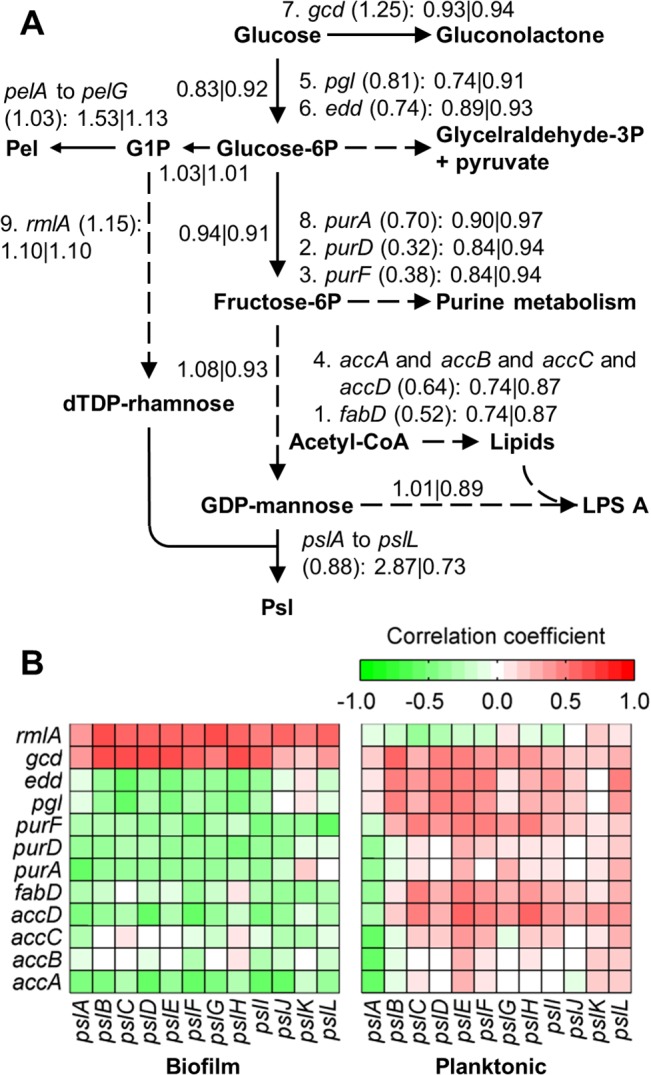
Fig 3. Coordinated regulation of Psl synthesis.

(A) Sketch of the metabolic pathways involved in the increase of Psl and Pel production rates in our simulations. The figure shows the genes associated with the nine reactions that had the highest effect on Psl production. The number to the left of each gene name denotes the rank of the corresponding reaction. The number in parentheses denotes the overall gene expression ratio between the biofilm and the stationary cultures. The numbers to the left and right of the vertical bar denote the median flux ratios of the reactions associated with the genes in simulation with or without the gene expression ratios of the genes accABCD, fabD, purADF, pgl, edd, gcd, and rmlA. Only psl, pel, and those genes whose regulation contributes to increasing Psl and Pel production are shown. (B) Correlation between the expression of the genes that contribute to increasing Psl production and the psl operon genes for biofilm and stationary cultures. Solid and dashed arrows indicate single and multiple reaction steps in the model, respectively.
