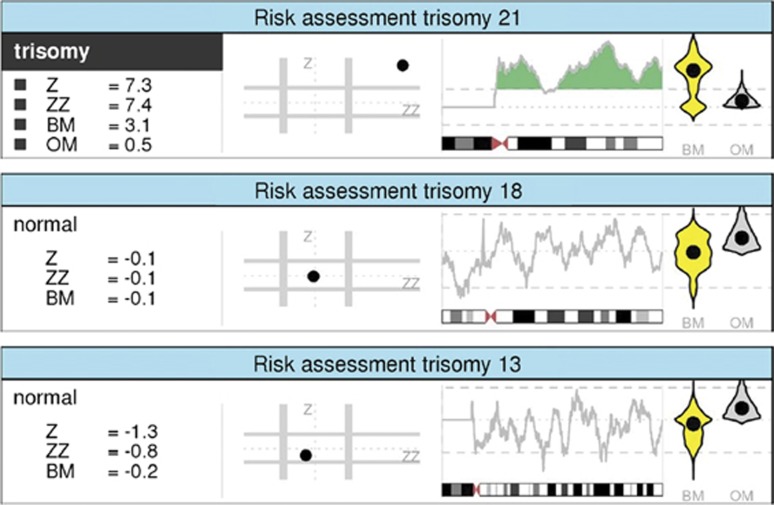
Figure 1.
An example report of a trisomy 21 sample. Details are shown for chromosomes 13, 18 and 21, and for each chromosomes z, zz and BM scores are indicated. When aneuploidy is present, the OM is shown for comparison with BM score. Dot plots of z- vs zz-score (Y and X axis, respectively) are shown with undetermined zones marked (2.5–3) with grey lines. Z-scores of 5 Mb sliding windows are plotted across the chromosome to visualize the aberrations, dotted lines represent ±1.5 z-scores and the areas above and below these cutoff values are coloured in green and red, respectively. Violin plots of BM and OM with their respective median shown with a single dot represent the distribution of all the bin-level z-scores.

