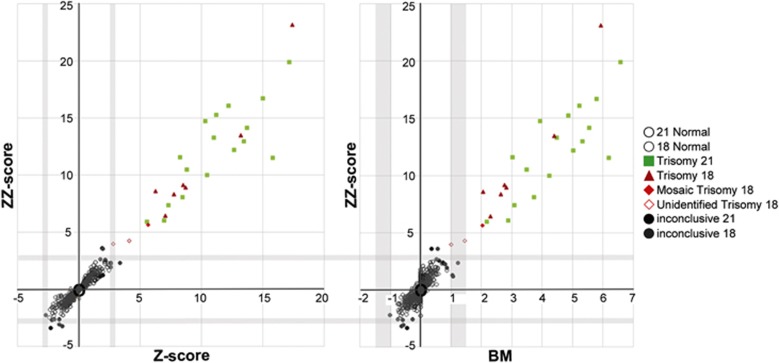
Figure 3.
Z-score vs zz-score (left), and BM vs zz-score (right) for chromosomes 21 and 18 results from all validation study samples. This highlights how the combined analysis reduces potential false-positive and false-negative cases. Triangles and boxes represent trisomies 18 and 21, respectively. Full diamond shape is the mosaic trisomy 18 case, whereas the hollow diamond shapes represent the undetermined trisomy 18 cases. Hollow circles represent the normal population, and full circles represent the cases classified as undetermined by the automated pipeline. The shaded lines on the X and Y axis mark the inconclusive zones between the cutoff values of 2.5–3 for both z- and zz-score, and 1–1.5 for the BM.

