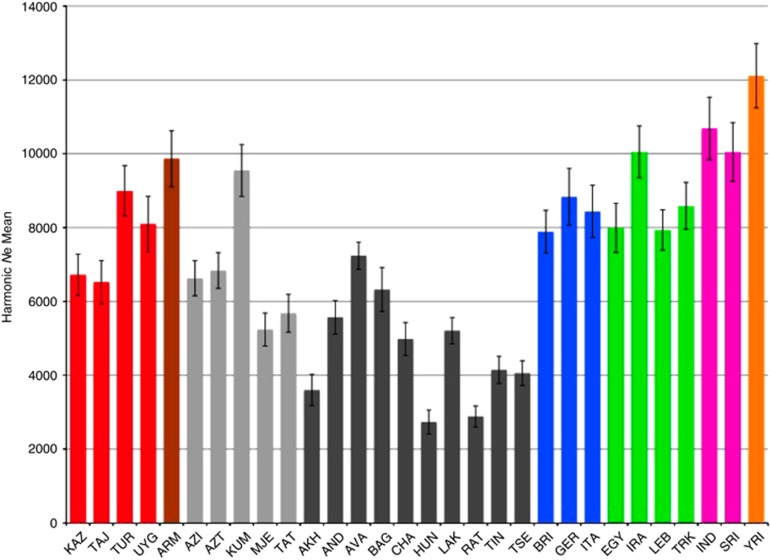
Figure 5.
The harmonic mean of Ne for each population with sample size N≥10 over 50 recombination distance classes between 0.005 and 0.25 cM with increment 0.005 cM. The SEs for Ne indicated by the bars were derived from separate analysis of each autosomal chromosome. Yorubans were included for comparisons with published data.

