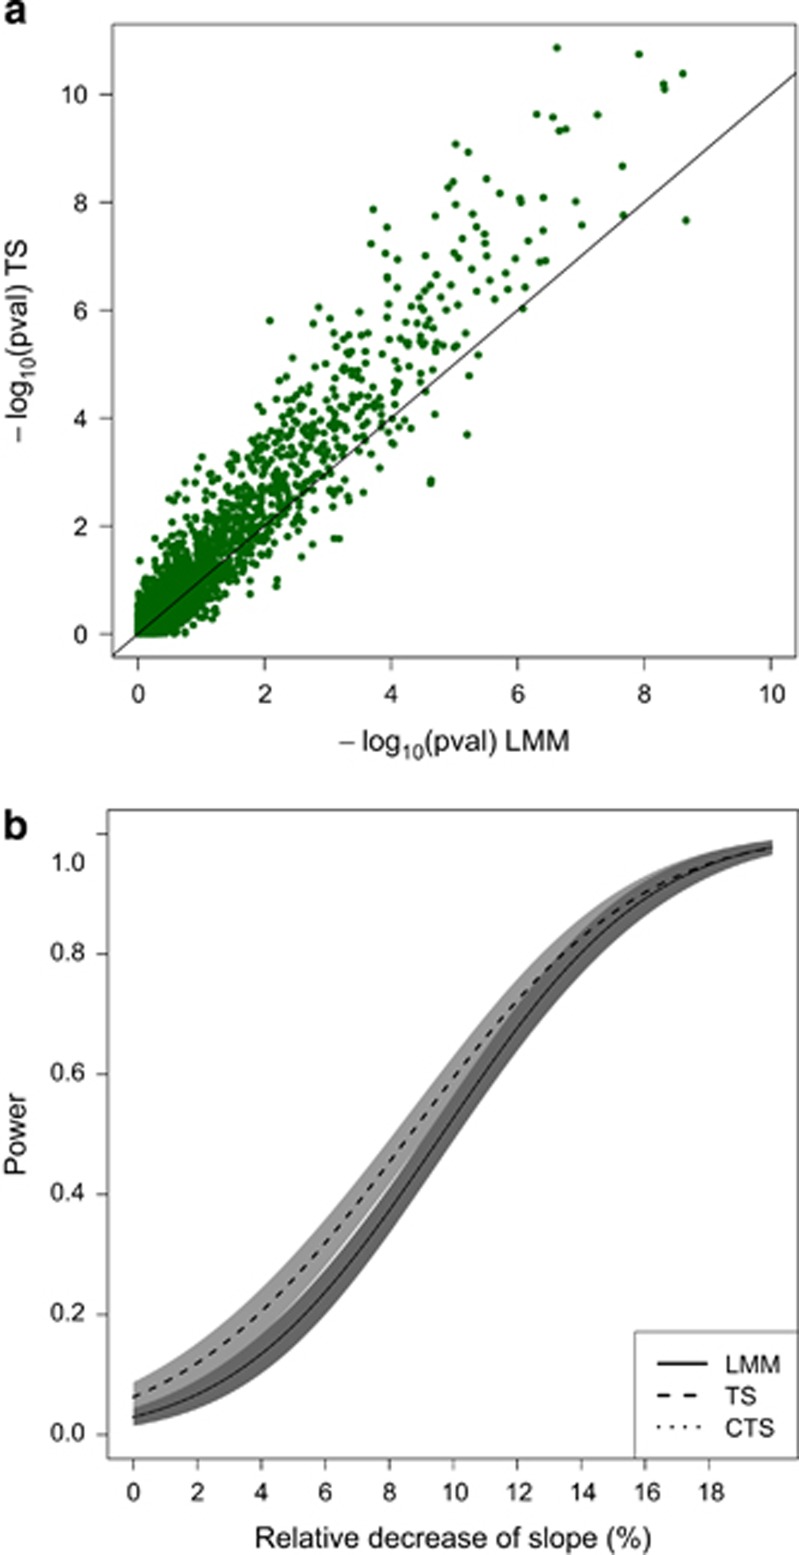
Figure 3.
Balanced case, Scenario 1 with β1=0.05. Panel (a) shows the approximation given by the two-step. Panel (b) shows the power curves (and 95% pointwise CI) for LMM, TS and CTS. The x axis of the power plot represents the relative reduction of the slope per one unit increase in reference allele. In the plot displaying accuracy, results of simulations under the null and under alternative have been merged.

