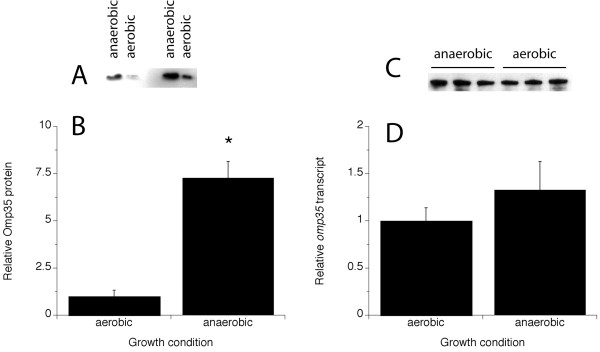
Figure 3.

Relative levels of Omp35 protein (A, B) and omp35 transcript (C, D) in aerobically-grown versus fumarate-grown MR-1. A, B: Omp35 protein was detected by western blot of whole cells using an antibody specific for Omp35. An example of two dilutions of a representative experiment are shown in panel A, and the quantitative results from densitometric analysis of western blots from three independent experiments (mean ± S.D.) are shown in panel B. *, statistically different from aerobic to P ≤ 0.001. C, D: Transcript was determined by RNase protection using an antisense probe specific for the omp35 transcript. The data for three independent experiments are shown in panel C, and the quantitative results from densitometric analysis of the RPA blots (mean ± S.D.) are shown in panel D. For each experiment, dilutions of each sample were analyzed to ensure linearity of signal intensity.
