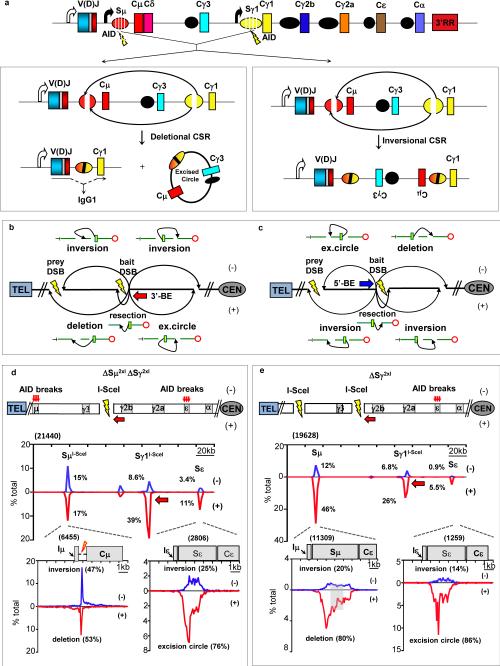
Figure 1. S region-dependent orientation-biased joining in CSR-stimulated B cells.
(a) Upper: IgH CH locus with AID-targeting (bolts) in Sμ and Sγ1. Lower: Productive (left) CSR via deletional Sμ to Sγ1 joins plus excision circles; Inversional (right) CSR. (b, c). Joining outcomes from 3’ (red arrow) or 5’ (blue arrow) bait BEs (bolts/gaps) to prey BEs5. (d) Upper: Joining between I-SceI DSBs at Sγ1 and Sμ in ΔSγ12xIΔSμ2xI B cells12. Middle: Location of bait BE junctions to I-SceI-generated ΔSμ2xI or AID-initiated Sε prey BEs in either + (red) or - (blue) orientation (five experiments) as percentage of total IgH junctions (2 kb) bins. Lower: Junction distribution to 10 kb region encompassing I-Sce1 prey DSBs at Sμ and AID-initiated prey DSBs at Sε. (e) Results from Sγ12xI/WT B cells12 plotted as in (d). Grey box indicates prey junctions not assignable to single core-Sμ sequence. Numbers in parenthesis denote total unique junctions. Statistical analyses in Extended Data Fig. 2h,j.

