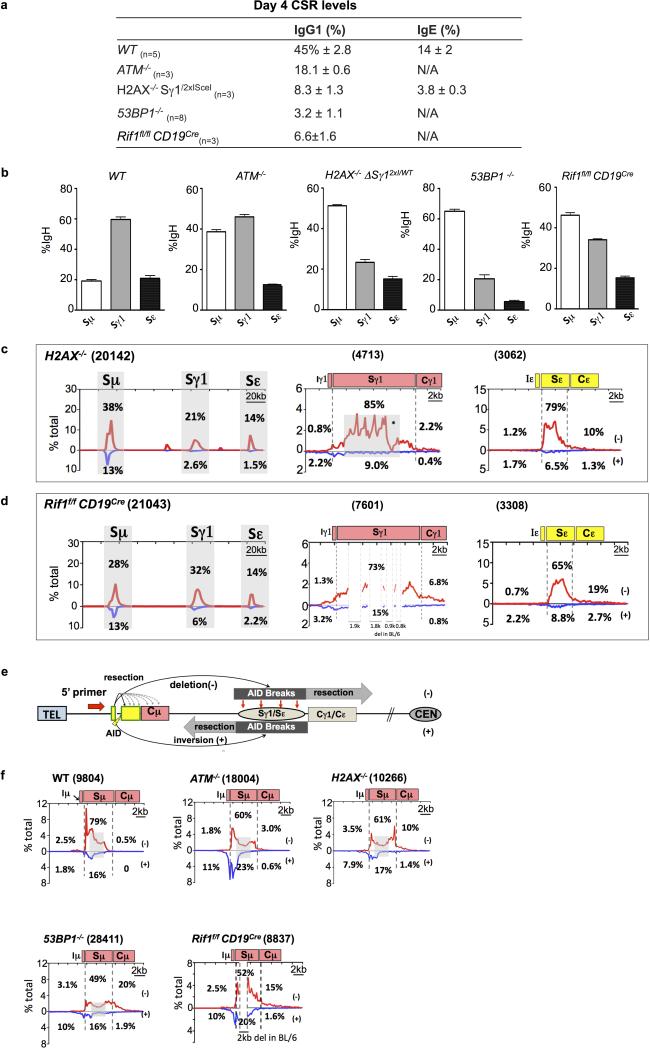
Extended Data Figure 6. Level of junctions to downstream S regions in WT and DSBR-deficient 5’Sμ HTGTS libraries correlate with CSR levels. | 5’Sμ breaksite undergoes variable degrees of resection from stimulated DSBR-deficient B cells.
(a) Table showing IgG1 and IgE CSR levels of splenic B cells from various genotypes (with number of replicates indicated) activated in vitro with anti-CD40 + IL4. FACS was performed on day 4 and values indicate average ± s.d.
(b) Left panel shows bar graph for percentage of junctions (average ± s.d.) recovered from WT 5’Sμ 5’-BE libraries mapped to the Sμ, Sγ1 and Sε over the total number of junctions identified from the 200 kb IgH constant region. Remaining panels shows the similar results from different DSBR-deficient backgrounds using the same 5’-BE primer.
(c and d) 5’Sμ 5’-BE HTGTS libraries analyses from H2AX-/- and RIF1fl/fl CD19Cre B cells are shown respectively.
(e) Diagram of potential junction outcomes from 5’Sμ AID-initiated 5’BE junctions to AID-initiated DSBs in Sγ1 and Sε.
(f) Data from HTGTS libraries mapped to the 20kb region flanking 5’Sμ breaksite from B cells stimulated with anti-CD40/IL4 in WT and DSBR-deficient backgrounds.
For detailed legends refer to Supplementary Information.

