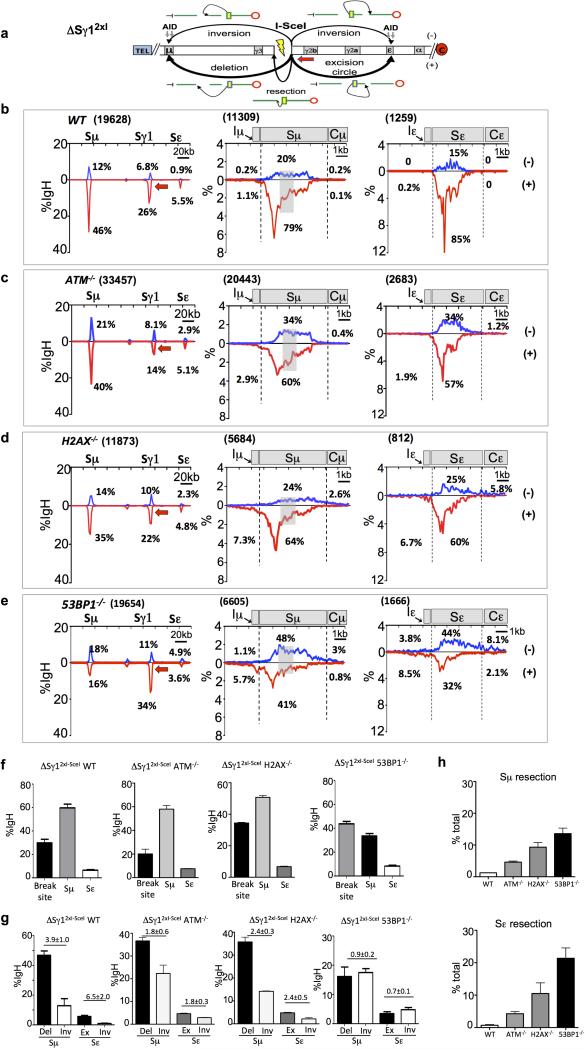
Extended Data Figure 8. Orientation-biased joining of I-SceI DSBs at Sγ1 to AID-induced S region breaks in various DSBR-deficient backgrounds.
(a) Schematic illustration of the ΔSγ12xI allele and joining outcomes from 3’BE (red arrow) to AID-initiated upstream Sμ and downstream Sε DSBs.
(b) Linear distribution of junctions between ΔSγ12xI-3’BE to AID-induced Sμ/Sε region DSBs in anti-CD40/IL4 stimulated WT (b, n=4), ATM-/- (c, n=3), H2AX-/- (d, n=3) and 53BP1-/- (e, n=4) cells across the 200 kb IgH region (first panels), 10kb-Sμ (second panels) and Sε (last panels).
(f) Bar graphs for percent of junctions mapped at ΔSγ12xI (breaksite), Sμ and Sε over the total number of junctions in the 200 kb IgH constant region in different genotypes.
(g) Bar graphs with percent of junctions from above various genotypes of ΔSγ12xI-3’BE libraries mapped to Sμ and Sε as average ± s.d.
(h) Comparison of percentages of junctions cloned using ΔSγ12xI-3’BE involving resection of Sμ (top panel) and Sε (bottom panel) breaks in indicated backgrounds.
For detailed legends refer to Supplementary Information.

