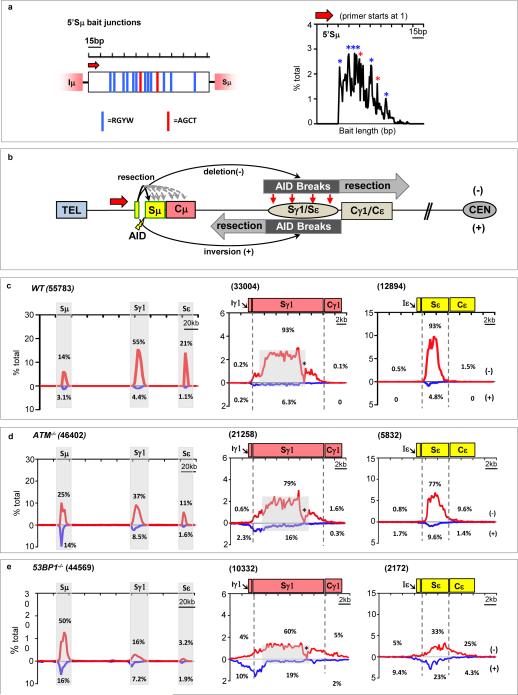
Figure 3. Orientation-biased joining of AID-initiated endogenous S region breaks.
(a) Left: 150-bp 5′Sμ sequence used as HTGTS bait. Red arrow denotes 5′Sμ primer. Red and blue vertical lines indicate AGCT or other AID-targeting motifs, respectively. Right panels: Distribution and frequency of 5’Sμ breakpoints in junctions to downstream S regions recovered from αCD40/IL-4-stimulated WT B cells. Asterisks indicate position of AGCT or other RGYW motifs. (b) Junctional outcomes from 5′Sμ AID-initiated BE junctions to AID-initiated DSBs in Sγ1 and Sε including deletions (-) or inversions (+); long resections indicated by grey arrows. Break-site 5′Sμ resections also are depicted. (c-e) Linear distribution of pooled junctions along 200 kb CH locus (left) or at Sγ1 and Sε (middle and right) recovered from three independent experiments with αCD40/IL4-stimulated WT (c), ATM-/- (d) or 53BP1-/- (e) B cells. Grey boxes indicate repetitive sequences with junctions mapping to multiple locations in Sγ1; asterisk indicates G-rich Sγ1 region devoid of AID motifs and junctions.

