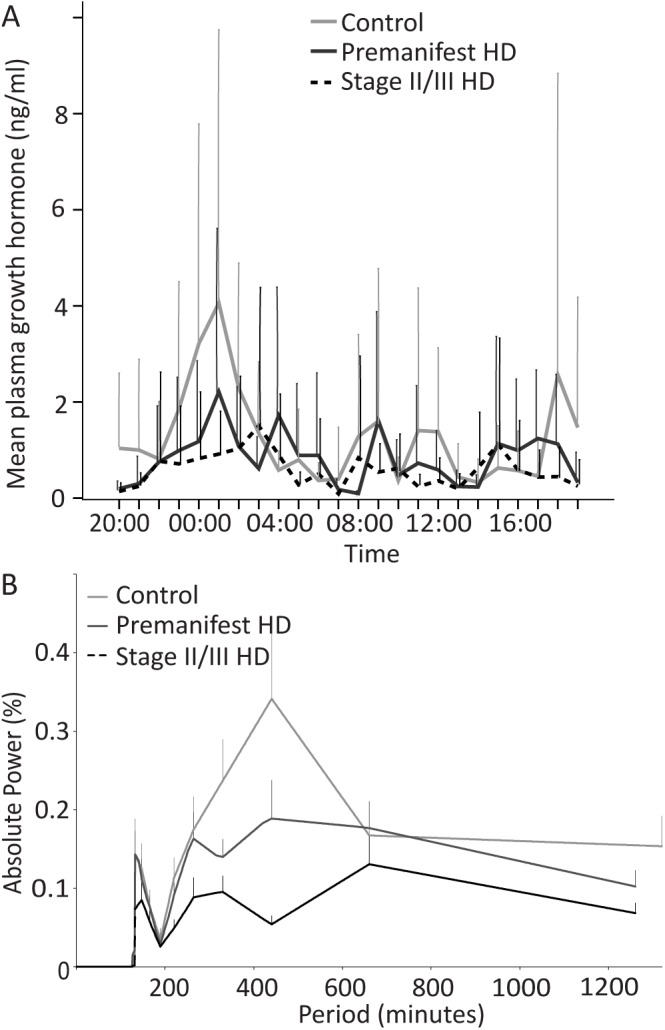
Fig 2. Analysis of GH in control, premanifest and stage II/III HD cohorts.

A: Mean GH concentrations over 24 hour sampling period in the three groups. B: FT analysis of GH plotting strength/power (%) against frequency (minutes) of GH oscillations for the three groups.
