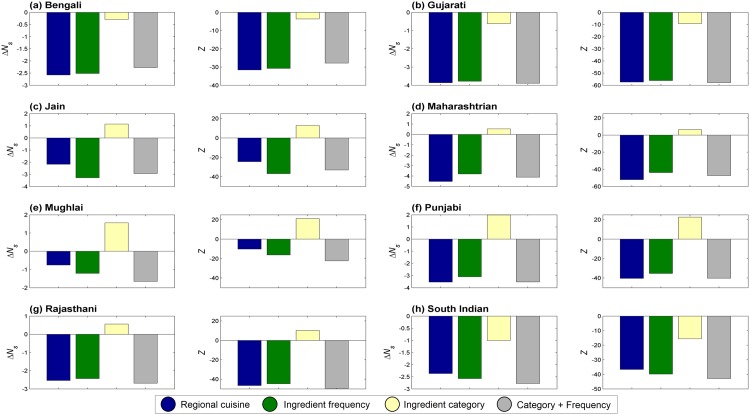
Fig 4. ΔN s and its statistical significance.
The variation in ΔN s for regional cuisines and corresponding random controls signifying the extent of bias in food pairing. Statistical significance of ΔN s is shown in terms of Z-score. ‘Regional cuisine’ refers to each of the eight cuisines analyzed; ‘Ingredient frequency’ refers to the frequency controlled random cuisine; ‘Ingredient category’ refers to ingredient category controlling random cuisine; and ‘Category + Frequency’ refers to random control preserving both ingredient frequency and category. Among all regional cuisines, Mughlai cuisine showed least negative food paring (ΔN s = −0.758) while Maharashtrian cuisine had most negative food pairing (ΔN s = −4.523).

