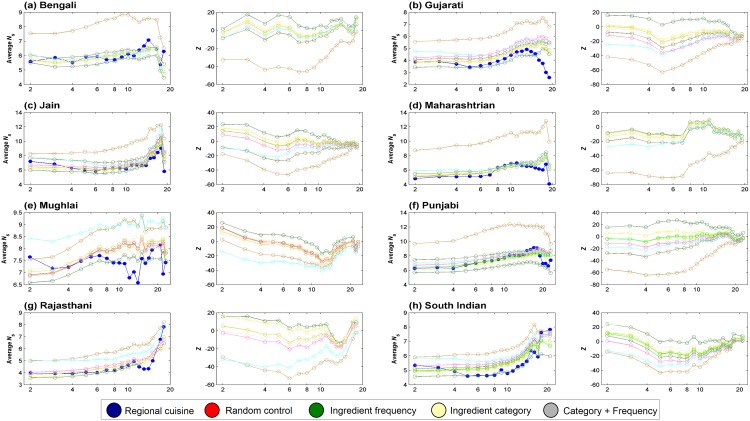
Fig 5. Variation in average N s and its statistical significance.
Change in with varying recipe size cut-offs reveals the nature of food pairing across the spectrum of recipe sizes. The values for regional cuisines were consistently on the lower side compared to their random counterparts. Category controlled random cuisine displayed average N s variation close to that of the ‘Random control’. Frequency controlled as well as ‘Category + Frequency’ controlled random cuisines, on the other hand, displayed average N s variations close to that of the real-world cuisine.

