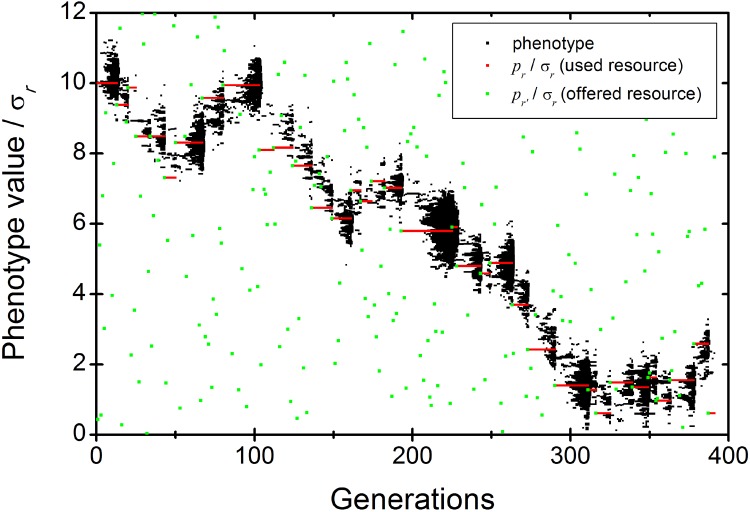
Fig 2. Temporal evolution of the information space of the parasite population.
The black dots represent all different population phenotypes. The red line is the optimum phenotype value favored by the colonized resource (r). The green points represent the optimum phenotype favored by a new resource (r') offered at each new generation. When a new resource is successfully colonized, the source population isn’t plotted any more (the end of a red line means an extinction only for the last generation). Parameters used in this simulation are listed in Table 1.

