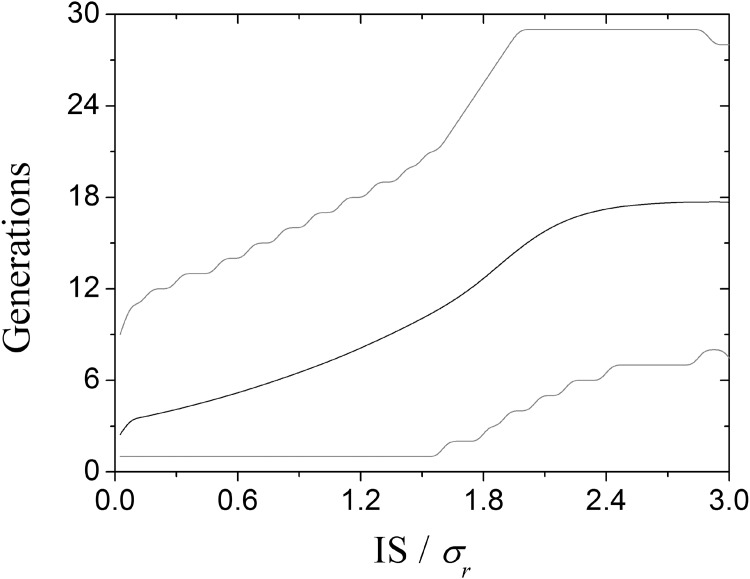
Fig 3. Relation between the size of IS and the number of generations in a specific host just before a successful colonization.
Black and gray lines show the mean and the 95% confidence interval, respectively. This graph considers 109 repetitions of the parameter values listed in Table 1.

