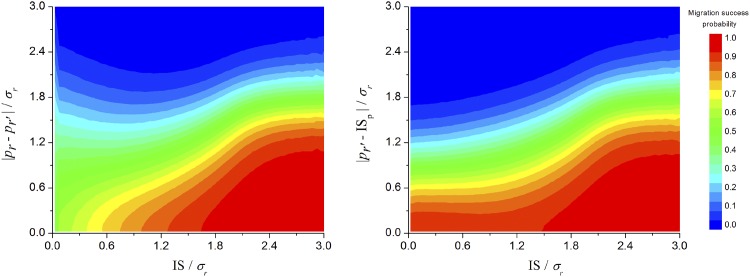
Fig 5. Phase diagrams.
Each diagram shows the probability of successful colonization (color legend at right) as function of information space (IS) and (a) absolute distance between colonized resource and the new available one; (b) absolute distance between the new resource available and the midpoint of population phenotype distribution. This graph considers 109 repetitions of the parameters values listed in Table 1.

