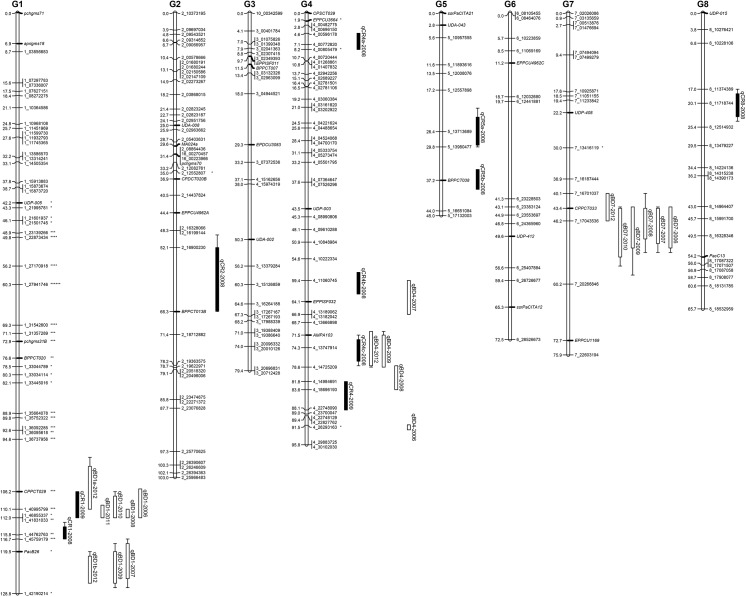
Fig 1. Linkage map of F2 mapping population segregating for chilling requirement (CR) and bloom date (BD).
Linkage group numbering corresponds to the peach reference genetic map. Left side of bars are marker distances in cM. Labels on the right side of bars are the marker name. Markers with names followed by an asterix have significantly distorted genotypic ratios (*, p<0.05; **, p<0.01; ***, p<0.005; ****, p<0.001; *****, p<0.0005; ******, p<0.0001). Italicized labels are SSR markers, all other markers are SNPs and are named for the scaffold and bp position on the scaffold as found in the Prunus persica genome (v1.0). QTL intervals are shown to the left of each LG. Bars and whiskers on QTL represent the 1 LOD and 2 LOD confidence intervals from the QTL peak, respectively. Chilling requirement and bloom date QTLs are represented by solid and hatched bars, respectively. A QTL is named as qXXYa—ZZZZ, with ‘XX’ being the trait abbreviation, ‘Y’ the number of the linkage group, ‘a’ the letter to specify different QTLs for the same trait in one linkage group (G), and ‘ZZZZ’ the year in which the trait was phenotyped.

