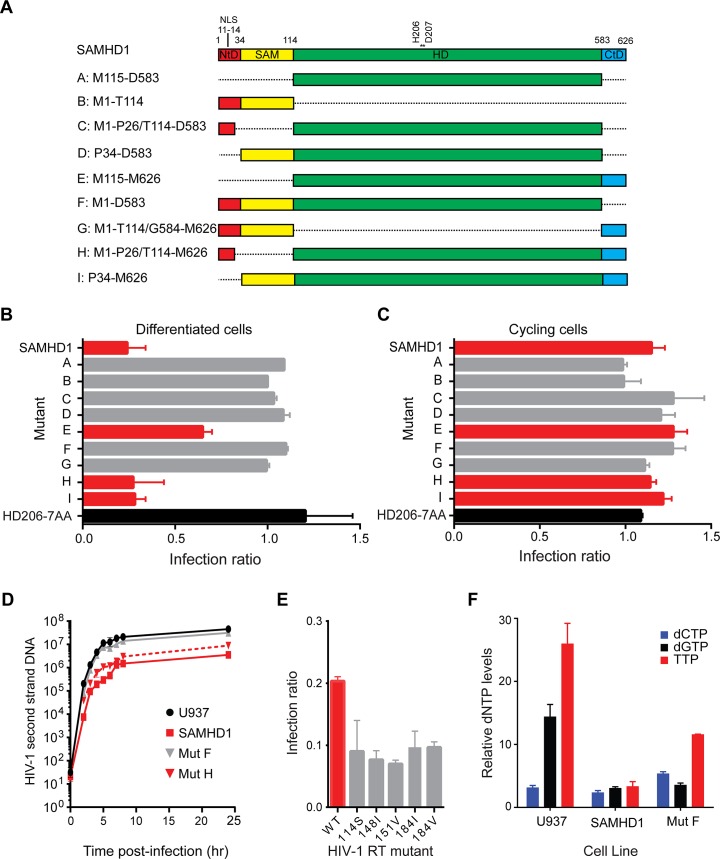
Fig 1. Restriction activity of SAMHD1 deletion constructs.
(A) Schematic of SAMHD1 mutants showing the N-terminal domain in red with nuclear localisation signal (NLS), the sterile alpha motif (SAM) domain in yellow, the HD domain in green and the C-terminal domain (CtD) in blue. Positions of domain junctions along with active site point mutation residues are numbered above. The identifier (A–I) and amino acids present in each mutant are indicated on the left. (B) Restriction of HIV-1 in differentiated cells. U937 cells were transduced with full-length SAMHD1, catalytically inactive SAMHD1(HD206-7AA) or domain mutant VLPs co-expressing YFP. Cells were differentiated after three days and 72 hours later, infected with HIV-1GFP virus. The bar graph shows the degree of restriction compared to SAMHD1 negative cells. Red bars highlight restriction competent SAMHD1. The black bar is the negative control, SAMHD1(HD206-7AA). Error bars represent the range for n ≥ 8 independent experiments. (C) Restriction of HIV-1 in in cycling cells. U937 cells were transduced and infected as in B but without differentiation. The bar graph shows the degree of restriction with error bars representing the range for n = 3 independent experiments. Red bars represent constructs that are able to restrict HIV-1 in differentiated U937 cells. (D) Inhibition of second-strand reverse transcription products by SAMHD1. U937 cells were transduced with SAMHD1 or domain mutant SAMHD1, differentiated and infected with DNase-treated HIV-1GFP. Cells were harvested at the indicated time points post-infection and second-strand reverse transcription products were detected by qPCR. Graph shows a representative experiment (n ≥ 6). Error bars are the standard deviation within the qPCR replicate (E) SAMHD1 restriction of HIV-1 RT mutants. U937 cells were transduced with SAMHD1, differentiated as in B, and then infected with HIV-1GFP virus carrying the indicated mutations in RT. The bar graph shows relative restriction compared to wild type (WT) HIV-1GFP. Error bars represent the range for n = 3 independent experiments. (F) Analysis of cellular dNTP levels. U937 parental cells or cells stably expressing either full-length SAMHD1 or mutant F/ SAMHD(1–583) were differentiated by adding PMA and 72 hours later dNTPs were extracted for quantification. The bar graph shows the relative amounts of each indicated dNTP in each cell line. Error bars represent the range for n = 3 independent experiments.

