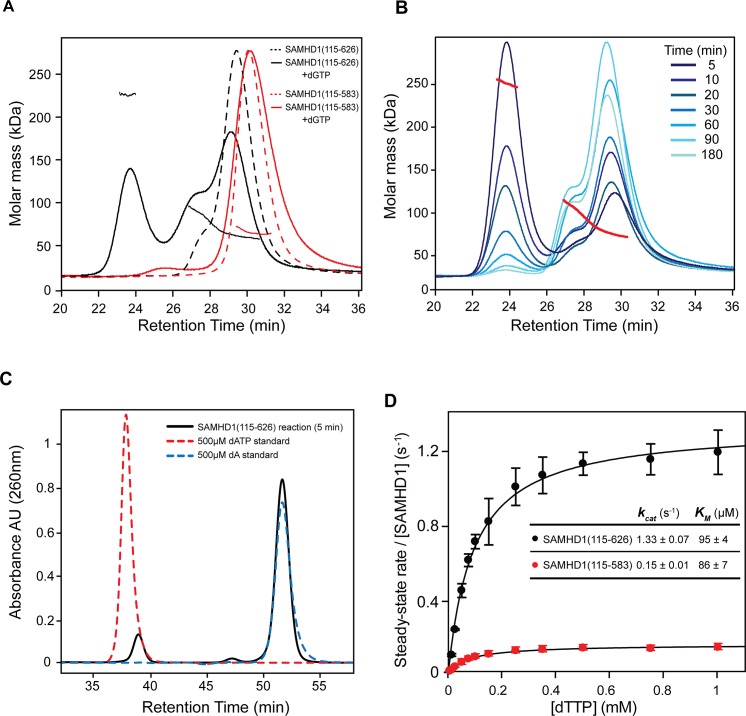
Fig 2. Solution oligomeric state and steady state kinetics of SAMHD1.
(A) SEC-MALLS analysis of SAMHD1 monomer-dimer-tetramer equilibrium for SAMHD1(115–583) (red) and SAMHD1(115–626) (black). The chromatograms are the output from the differential refractometer. The points are the weight-averaged molar masses determined at 1-second intervals throughout elution of chromatographic peaks. Dashed line chromatograms are apo-protein, solid lines are upon addition of 0.5 mM dGTP (B) Tetramer stability. SAMHD1(115–626) was incubated with 0.1 mM GTP and 0.5 mM dATP for the specified time intervals and then the oligomeric state analysed by SEC-MALLS. (C) Analysis of dATP hydrolysis during the time course shown in B. The chromatogram (black) is the recorded UV absorbance at 260 nm from the SEC-MALLS column for the five-minute incubation time point. Reference chromatograms (dashed lines) for substrate dATP (red) and product dA (blue) are overlaid. (D) Steady-state kinetic analysis of GTP stimulated hydrolysis of TTP by SAMHD1. The dependence of the rate of on substrate concentration for SAMHD1(115–626) (black) and SAMHD1(115–583) (red) are plotted. Solid lines are the best fit to the data using the Michaelis-Menten expression. Error bars represent the standard error of the mean (SEM) of three independent measurements. The derived constants KM and kcat for the reaction are displayed inset.

