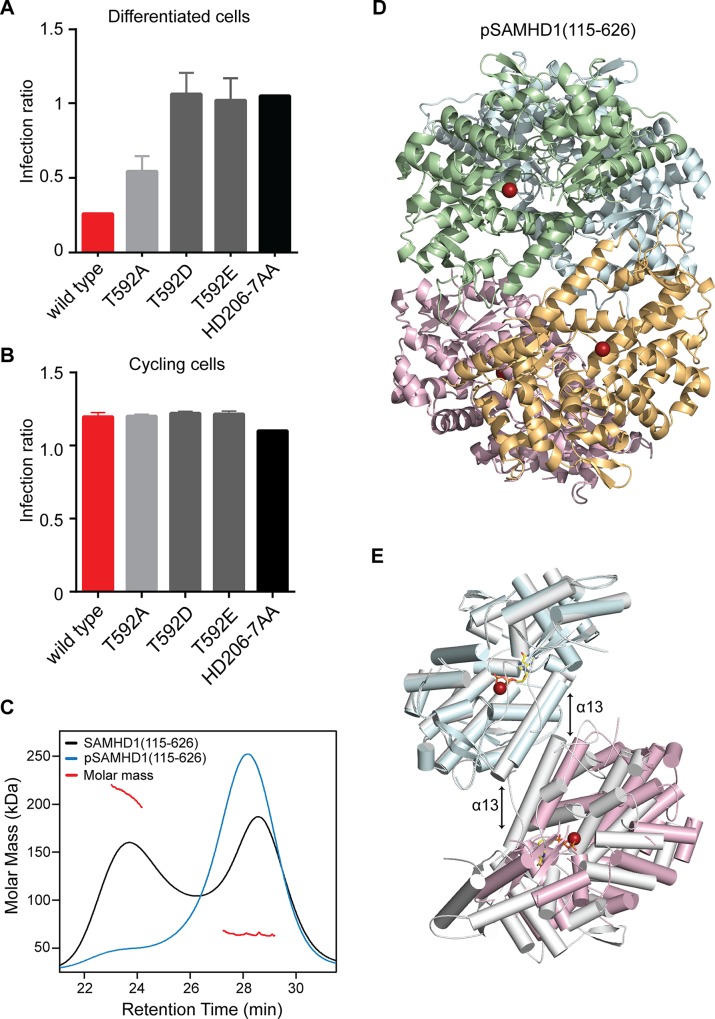
Fig 6. The effect of phosphorylation on SAMHD1 restriction and tetramerisation.
Restriction of HIV-1 infection by SAMHD1 Thr592 mutants in (A) differentiated and (B) cycling U937 cells. Cells were transduced with the indicated SAMHD1 phosphomimetic mutants, differentiated (A only), infected and analysed as in Fig 1. Bar charts show the fold restriction. Error bars represent standard deviation of the mean, (n = 6) for A and (n = 3) for B. (C) SEC-MALLS analysis of wild type SAMHD1(115–626) (black) and phospho-SAMHD1(115–626) (blue) incubated with 0.1 mM GTP and 0.5 mM dATP. The chromatograms are the output from the differential refractometer. The red points are the weight-averaged molar masses determined for the two peaks in the wild type protein. (D) Crystal structure of pSAMHD1(115–626) tetramer. Individual monomers are coloured cyan, green, magenta and orange. Active site bound Fe metal ions are shown as spheres. (E) Structural alignment of pSAMHD1(115–626) (cyan and magenta) and SAMHD1(115–583) (grey) tetramers. For clarity only two SAMHD1 monomers from each structure, comprising one dimer-dimer interface are shown. The structures were aligned on the upper dimer (cyan onto grey) to demonstrate the small displacement in the pSAMHD1(115–626) dimer-dimer interface with respect to that of the SAMHD1(115–583) structure (magenta onto grey). The α13 helix-pairs at the dimer-dimer interfaces are indicated by the double-arrows (left) SAMHD1(115–583) and (right) pSAMHD1(115–626). The active site Fe and ddGTP in SAMHD1(115–583) are also shown in sphere and in stick representation respectively.

