
Fig 1. Endocytic uptake of S. agalactiae by H9C2 cells.
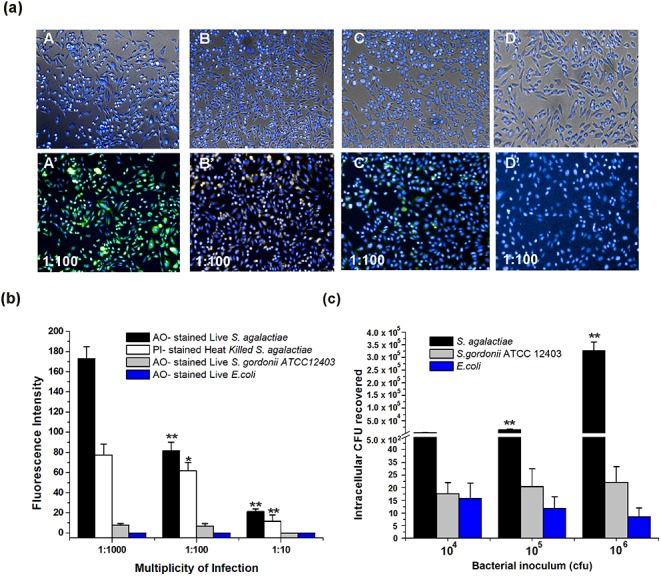
(a) Infection assay: A, B, C, D- merged images of bright field and Hoechst 33342 ‒stained H9C2 cells infected with live & heat‒killed S. agalactiae, S. gordonii ATCC 12403 and E. coli, respectively. A’, B’ C’, D’- merged images of H9C2 cells (counter-stained with Hoechst 33342 after infection) and endocytosed fluorescently labeled live‒ & heat‒killed S. agalactiae (AO & PI‒stained), S. gordonii ATCC 12403 (AO‒stained) and E. coli (AO‒stained), respectively. (b) Quantification of endocytic uptake of fluorescently‒labelled live & heat‒killed S. agalactiae, S. gordonii ATCC 12403 and E. coli by H9C2 cells. (c) Viable cell count of bacteria from infected H9C2 cells. H9C2 cells were infected with different inoculum of S. agalactiae, S. gordonii ATCC 12403 and E. coli (i.e., 104, 105 and 106) for 2 h. The recovered intracellular bacteria from H9C2 cells are represented as CFU/well (Mean ± SD) obtained from three independent experiments. Statistically significant differences are indicated by an asterisk (* p<0.05 or **p<0.01).