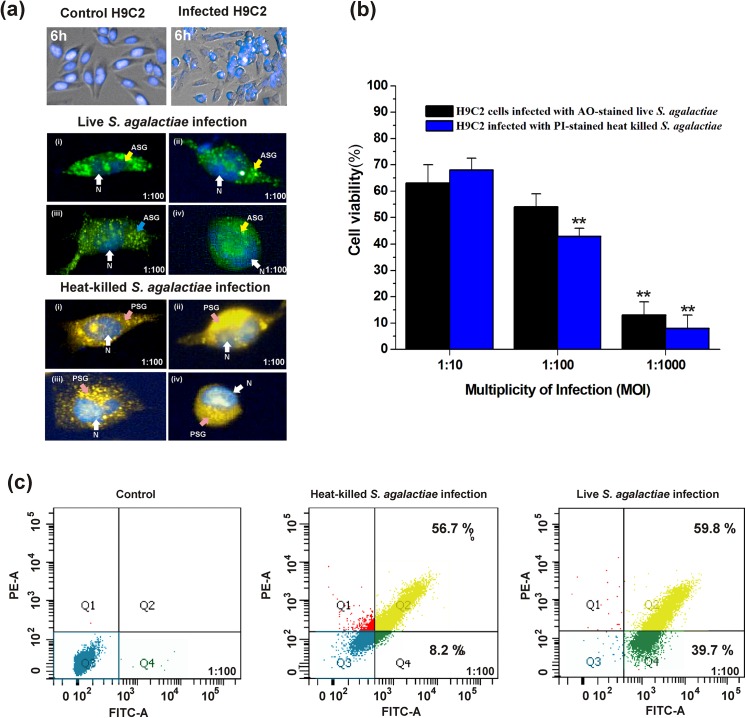
Fig 3. S. agalactiae‒induced cytotoxicity in H9C2 cells.
(a) Morphological changes induced by S. agalactiae in H9C2 cells after 6 h of infection, Top panel: S. agalactiae-infected and uninfected H9C2 cells after 6 h of infection. Middle and bottom panel: (i), (ii), (iii) & (iv) are representative confocal micrographs showing changes in H9C2 cell morphology within 6 h of infection with live (ASG) and heat‒killed (PSG) S. agalactiae. Nuclei (N) of H9C2 cells were shown by Hoechst 33342 staining. (b) Determination of live and heat‒killed S. agalactiae‒induced cytotoxicity in H9C2 cells by MTT assay. Statistically significant differences are indicated by an asterisk (* p<0.05 or **p<0.01). (c) Quantification of live and heat‒killed S. agalactiae‒induced cytotoxicity in H9C2 cells by flow cytometry. Q3‒live population of H9C2 cells (blue dots); Q4‒early apoptotic H9C2 cells (green); Q2‒late apoptotic H9C2 cells (yellow).

