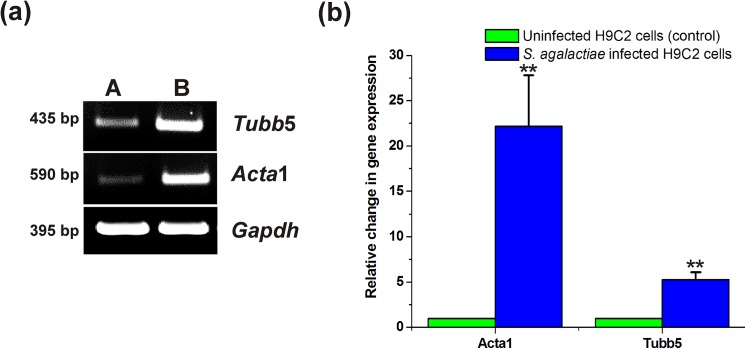
Fig 4. S. agalactiae‒infection induced gene expression of Tubb5 and Acta1 in H9C2 cells.
(a) Semi quantitative RT-PCR analysis for expression of cytoskeleton forming genes, Tubb5 and Acta1 in S. agalactiae‒infected (B) and uninfected (A) H9C2 cells (b) RT Q-PCR analysis for expression of Tubb5 and Acta1 in S. agalactiae‒infected and uninfected H9C2 cells. Gene expression values of the uninfected H9C2 cells (control) were set equal to 1 and the relative change in gene expression in S. agalactiae‒infected H9C2 cells were calculated. RT Q-PCR was performed twice independently and the triplicate measurements of gene expression per gene were included, which yielded similar results. Data shown are the mean relative change in expression ± standard deviation from one such experiment. Statistically significant differences are indicated by an asterisk (* p<0.05 or **p<0.01).

