
Figure 2.
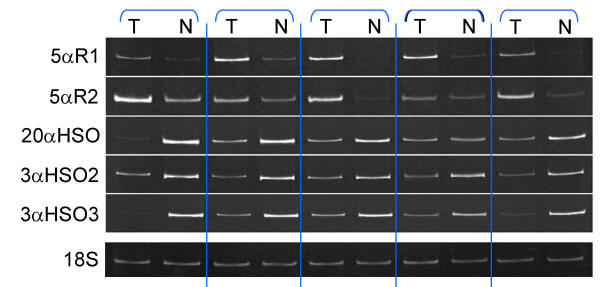
Representative RT-PCR results (gels) for 5 of the 11 tumor and paired normal breast tissue samples. For each tissue, 2 μg of total RNA was reverse transcribed using random primers, and aliquots of cDNA were PCR amplified, as described in the methods, with each of 6 primer sets. For each tissue, separate cDNA samples were amplified with primers specific to 18S rRNA (12 cycles), 5αR1 primers (27 cycles), 5αR2 (33 cycles), 20α-HSO, 3α-HSO2 and 3α-HSO3 (27 cycles each). Products were separated on 9% polyacrylamide gels. Note that intensity and abundance of 5αR1 and 5αR2 bands is greater, whereas that of the HSO bands is less in tumor than paired normal tissue samples.