
Figure 6.
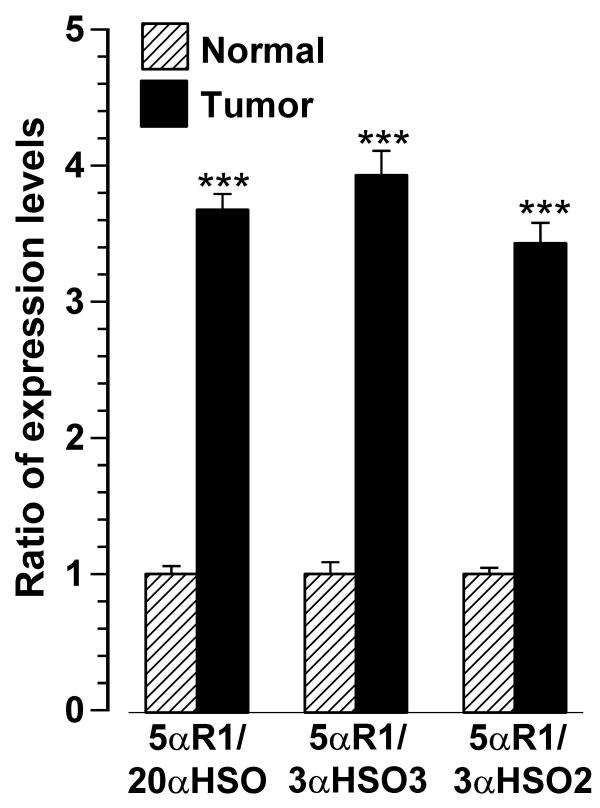
Expression level of 5αR1 as a ratio of HSO expression level in unpaired tumor and normal (mammoplasty) breast tissues. Each bar and line represents the mean ± SEM of the ratio for normal (adjusted to 1.0; n = 10) and tumor (n = 17) tissues. *** indicates significantly different from normal at p < 0.001.