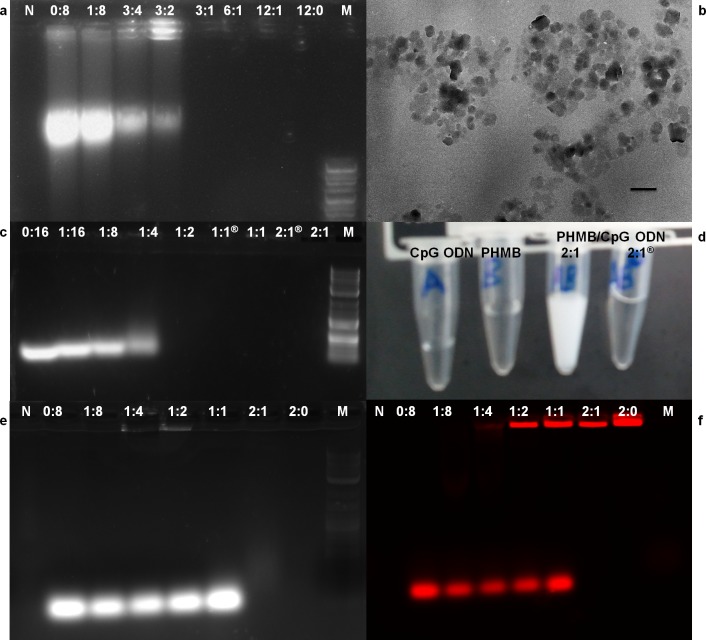
Fig 4. PHMB/DNA interactions and physicochemical characterization of polyplexes.
Formation of PHMB/DNA polyplexes confirmed by 1% agarose gel, TEM and color change. (a) PHMB/gDNA polyplexes, (b) TEM picture showing PHMB/CpG ODN polyplexes formation at 2:1 ratio, (c) PHMB/CpG ODN polyplexes, (d) temporary turbidity change during PHMB/CpG ODN complexation, (e) PHMB/CpG-R polyplexes and (f) the same gel (e) with fluorescence measurement of CpG-R. With the exceptions of negative control and PHMB alone, all wells contained equal amounts (weight) of DNA with various concentrations of PHMB. M represents 2-Log DNA ladder (0.1–10.0 kb, New England Biolabs) and N represents water used as a negative control. All indicated PHMB/DNA ratios are in relative weight (w/w). Indicates two month old PHMB/CpG ODN polyplexes. Scale bar = 300 nm.

