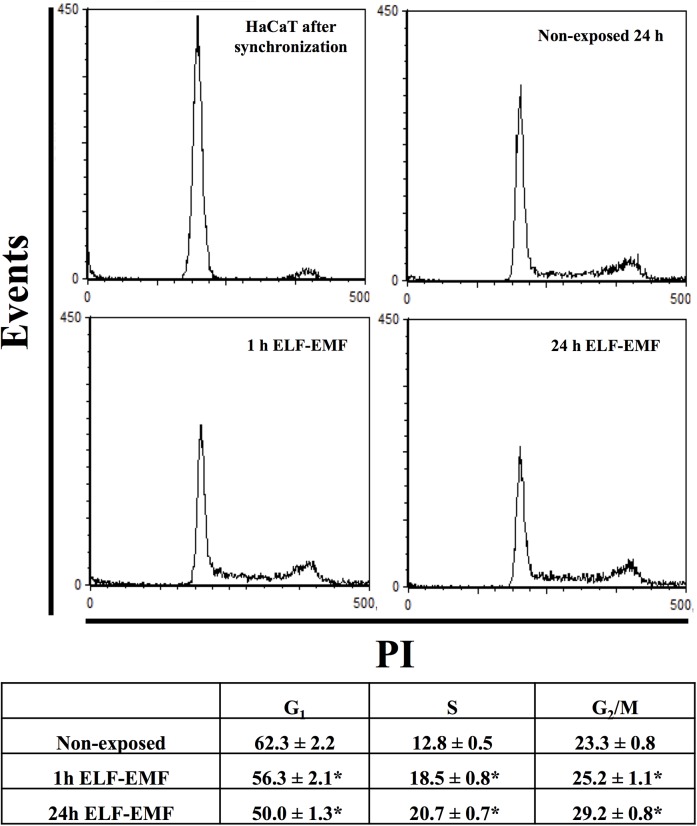
Fig 1. Cell cycle analysis.
Flow cytometry cell cycle analysis of HaCaT cells exposed to ELF-EMF (1 mT, 50 Hz) for 1 and 24 h, using PI (40 μg/ml) as probe. Percentage of fluorescent cells for G0/G1, S and G2/M phases were reported in the bottom panel. Mean±SD of three analyses is reported. *p<0.05 vs non-exposed cells.

