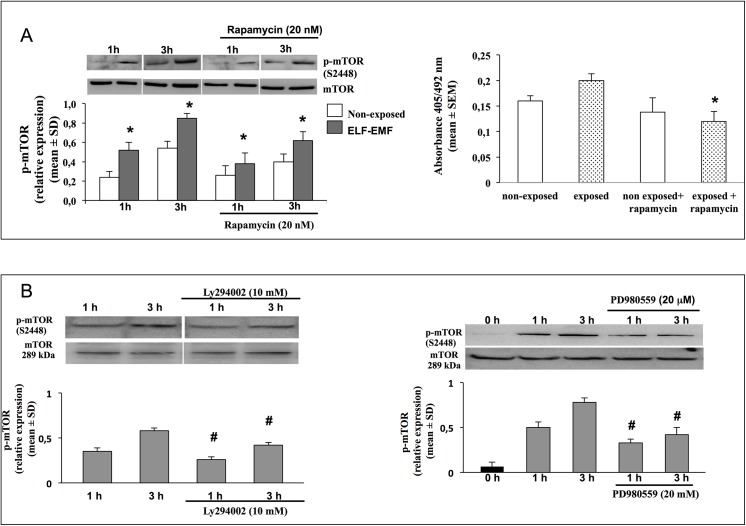
Fig 6. Effects of pharmacological inhibitors on mTOR activation.
A. Representative image of immunoblotting for p-mTOR in HaCaT cell non-exposed or exposed for 1 and 3 h to ELF-EMF and treated or not with 20 nM Rapamycin. Data are reported as relative expression of p-mTOR vs un-phosphorilated form (mean±SD, n = 3). * p<0.05 treated cells vs cells no-treated with Rapamycin (lef). Proliferative rate of HaCaT cells assed by BrdU incorporation assay, after 24 h of incubation in non-exposed and exposed to ELF-EMF only for the first hour, and treated or not with 20 nM Rapamycin. Each bar represents the mean±SEM of three independent experiments performed in triplicate. * p<0.05 treated cells vs cells no-treated with Rapamycin (right). B. Representative image of immunoblotting for p-mTOR in HaCaT cell non-exposed or exposed for 1 and 3 h to ELF-EMF and pre-treated or not with selective inhibitor of PI3K (Ly294002, 1 μM) and selective inhibitor of ERK kinase activity (PD980559, 1 μM). Data are reported as relative expression of p-mTOR vs un-phosphorilated form (mean±SD, n = 6). # p<0.05 treated cells vs cells no-treated with selective inhibitors.

