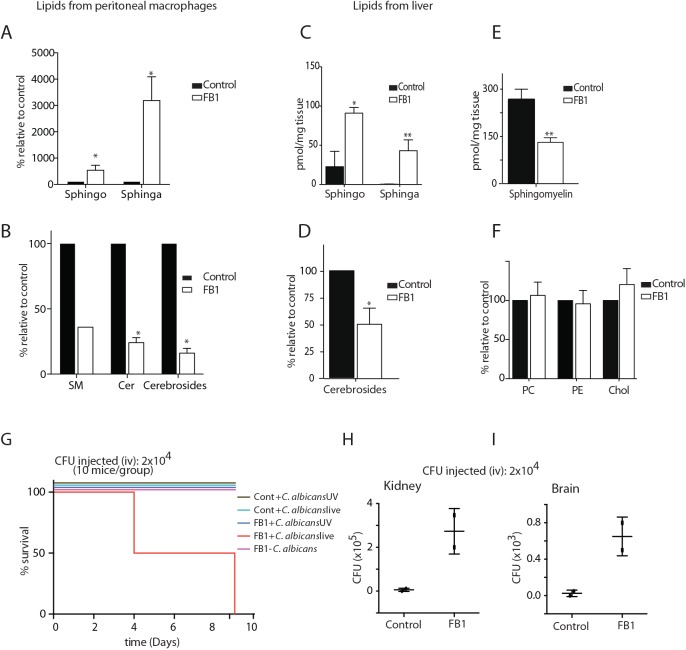
Fig 5. treated with FB1 show increased susceptibility to C. albicans infection.
(A—F) Total lipids were extracted from control and FB1-treated mice and subjected to LC/MS lipid profiling. The different classes of lipids from peritoneal macrophages (A, B) and liver tissue (C—F) are shown. (G) Survival curve of control and FB1-treated mice infected with live or UV-killed C. albicans. (H, I) Fungal load was determined from the kidney and brain tissues collected from the control and FB1-treated mice that were infected with C. albicans, and the number of colony forming units (CFU) is given. SM, sphingomyelin; Cer, Ceramide; Sphingo, Sphingosine; Sphinga, Sphinganine; Chol, Cholesterol.

