
Fig 2. Timing of stimulation impacts proliferative expansion and transcriptional program of 2° effector CD8 T cells.
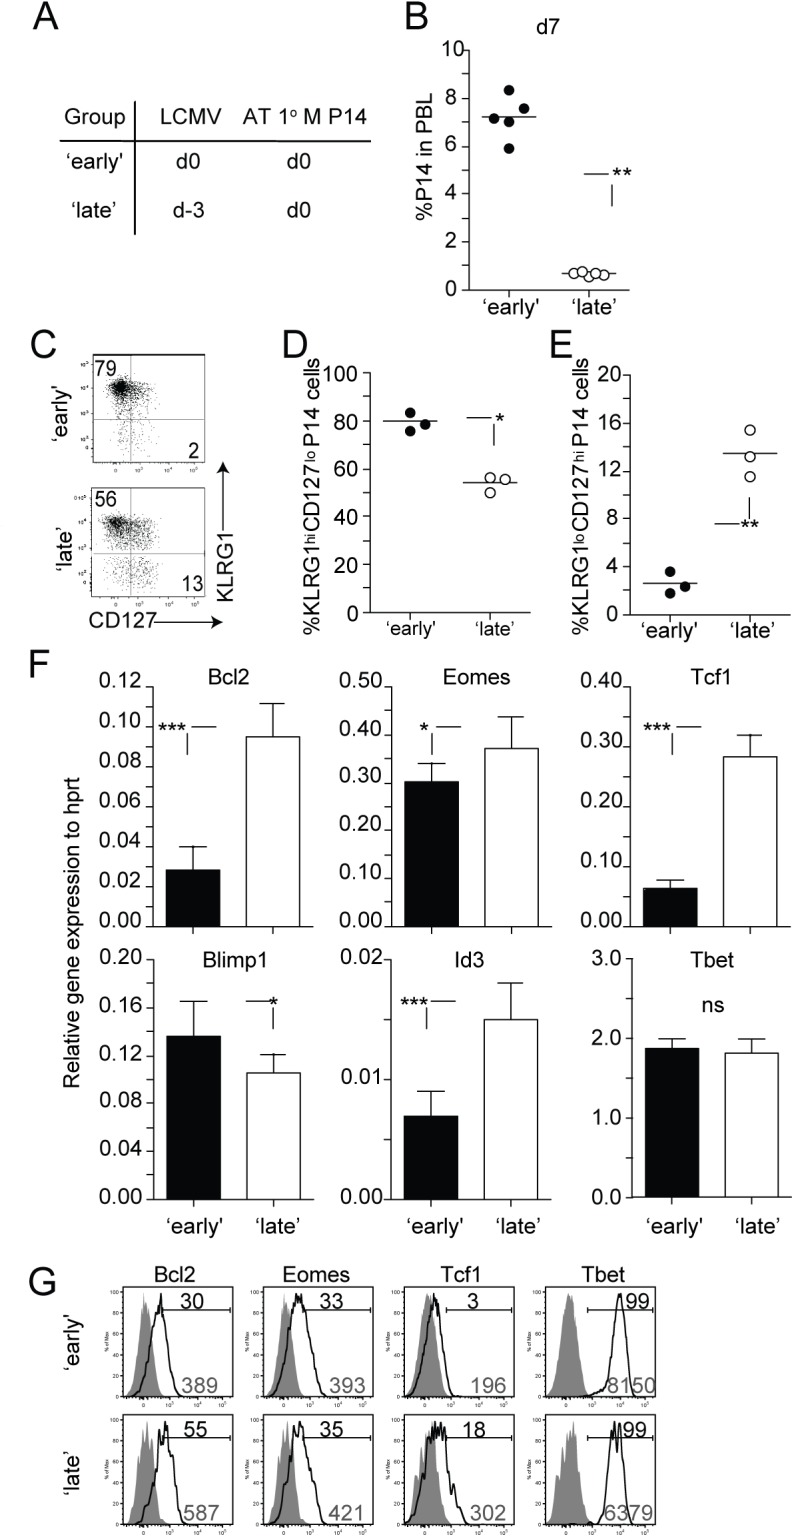
A) Experimental design. Naïve B6 Thy1.2/1.2 mice received a transfer of 1° M Thy1.1 P14 CD8 T cells (2x10⁴ cells/mouse, i.v.) on the day of (‘early’ group) or 3 days after (‘late’ group) infection with LCMV (2x10⁵ PFU/mouse i.p.). B) The percentage of 2° effector P14 CD8 T cells in the PBL at day 7 after transfer. Dots represent individual mice and the line represents the mean. C) Representative dot plots showing the expression of KLRG1 and CD127 molecules on 2° effector P14 CD8 T cells isolated from the spleen at day 7 after transfer. The percentage of 2° effector P14 CD8 T cells expressing a D) KLRG1hi CD127lo or E) KLRG1lo CD127hi phenotype. F) Total RNA was extracted from 2° effector P14 CD8 T cells and analyzed for the expression of indicated transcripts using quantitative RT-PCR. Relative expression to Hprt is shown. The data are mean + SD of triplicate measurements of a total of three samples from each group. G) Representative histograms showing the expression of the molecules Bcl2, Eomes, Tcf1, and Tbet on 2° effector P14 CD8 T cells from spleens of mice from ‘early’ and ‘late’ groups. Shaded graphs represent isotype control staining and open graphs represent specific Ab staining on gated 2° effector Thy1.1 P14 CD8 T cells. Black numbers indicate the percentage of P14 CD8 T cells positive for indicated markers and grey numbers indicate gMFI of P14 CD8 T cells. Data are of 3–5 mice per group and experiments are representative of 2–3 independent experiments. The p values are indicated.