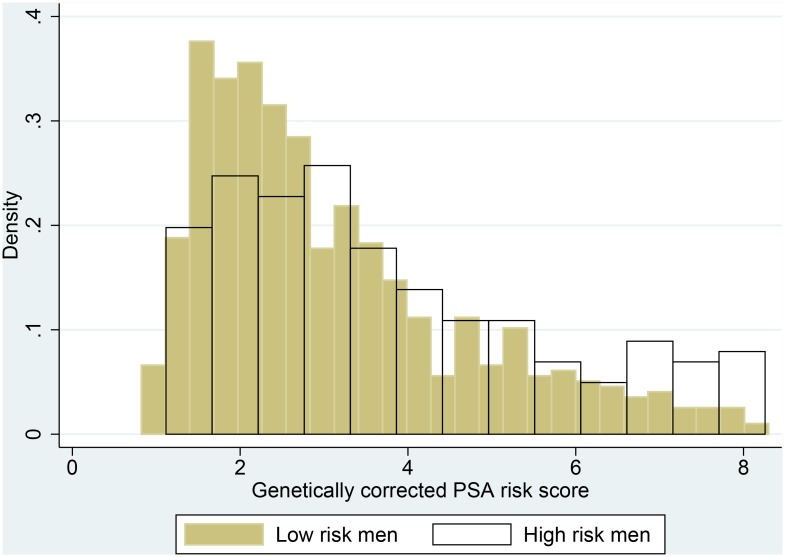
Fig 1. Histograms showing the distribution of genetically corrected PSA risk score.
Histograms showing genetically corrected PSA risk score, including information on the 4 PSA-SNPs using the published coefficients, stratified by high versus low risk of progression show no difference between men at high and low risk of progression.

