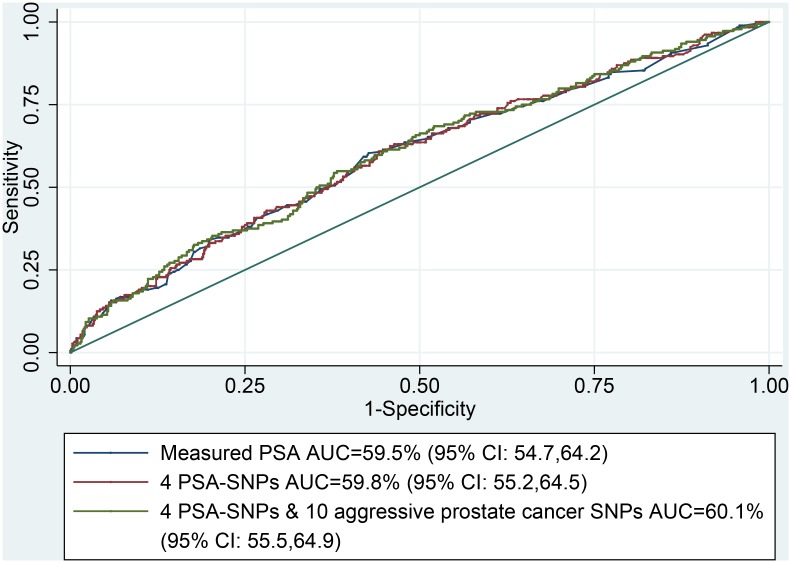
Fig 2. ROC curves comparing measured PSA to genetically corrected PSA risk score using the 4 PSA-SNPs.
Area under the curve (AUC) comparing measured PSA, genetically corrected PSA risk score based on 4 PSA-SNPs using the published coefficients and PSA risk score corrected for both 4 PSA-SNPs and 10 aggressive prostate cancer SNPs using published coefficients.

