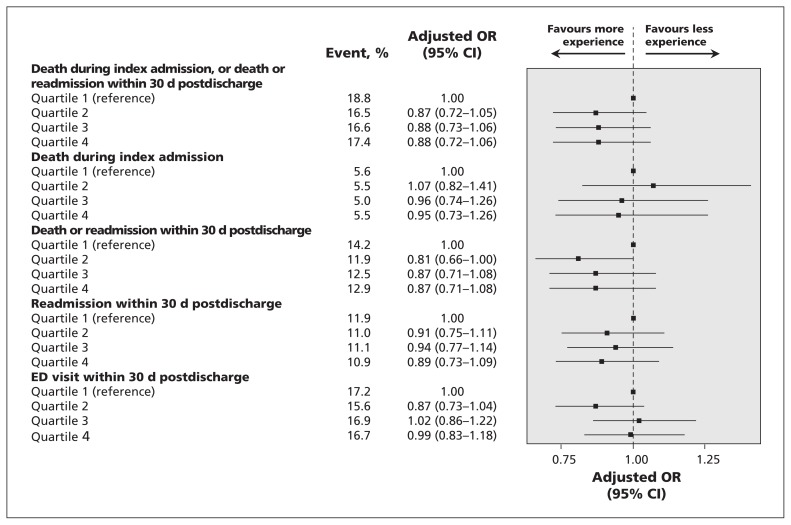
Figure 2:
Patient outcomes across quartiles of physician experience. Referent group for each comparison are patients cared for by the physician quartile with the least experience (quartile 1). Odds ratios less than 1 favour physicians with more experience. Adjusted odds ratios were obtained using logistic generalized linear mixed models, with physician as a random effect and fixed effects being patient age, sex, hospital and LACE score (except death during index admission, which instead used Charlson Comorbidity Index score). CI = confidence interval; LACE = length of stay, acuity of admission, comorbidities and emergency department (ED) visits; OR = odds ratio.

