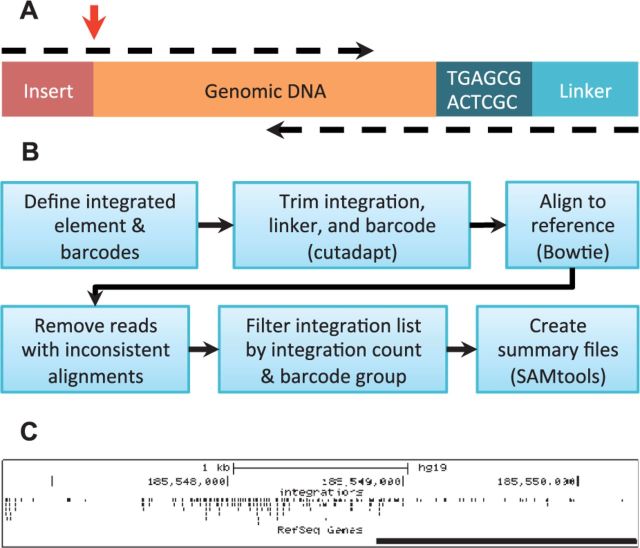
Fig. 1.
(A) The structure of the LM-PCR amplicons produced by the barcoding assay. Paired-end reads are represented as dashed arrows. GeIST is designed to identify the junction of the insert and the genomic DNA, indicated by the red arrow. (B) The GeIST workflow. (C) Example output of GeIST, in which the BED file is visualized on the UCSC genome browser (http://genome.ucsc.edu). This example shows the MLV integrations detected in human HepG2 cells in the span chr4:185,546,724–185,550,338

