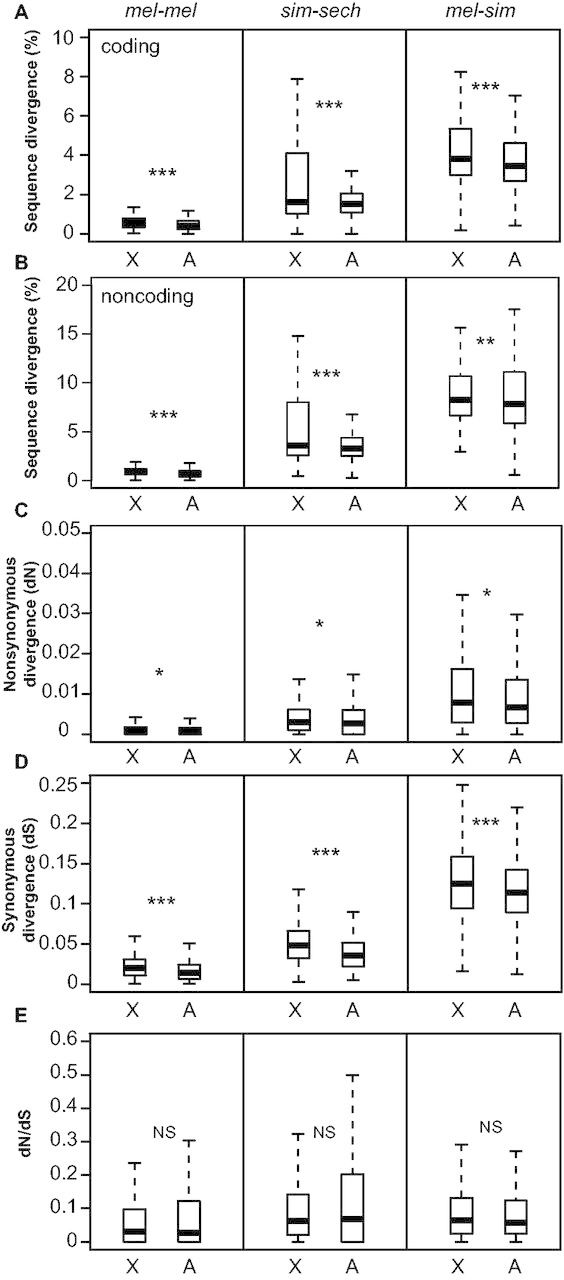
Fig. 1.

Faster-X divergence of DNA sequence. Percent sequence divergence is shown for coding (A) and noncoding (B) regions of each of the 4,851 genes analyzed in all three comparisons (mel-mel, sim-sech, mel-sim). Maximum-likelihood estimates of (C) nonsynonymous (dN) and (D) synonymous changes (dS) as well as (E) the ratio of nonsynonymous to synonymous changes (dN/dS) are shown. Boxplots show the distribution of these values separately for genes on the X chromosome and autosomes with the median (center line) as well as 25th and 75th percentiles indicated (box upper and lower bounds) and whiskers extending 1.5× the interquartile range. Statistical significance of the difference in median values between X-linked and autosomal genes was determined using Mann–Whitney U tests, where NS indicates not significant, *P ≤ 0.05, **P ≤ 0.001, and ***P ≤ 1 × 10⁻⁴.
