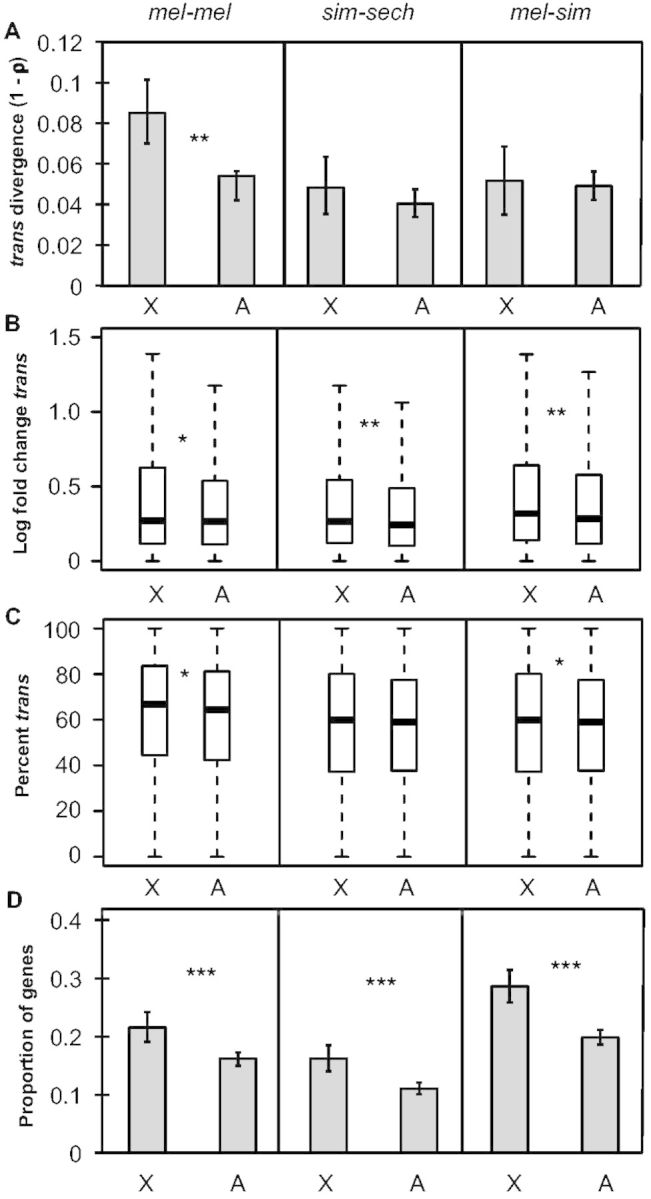
Fig. 4.

Faster-X divergence of trans-regulation. (A) Divergence in trans-regulatory activity (1 − ρ) is shown for genes on the X-chromosome and autosomes for all three comparisons and error bars represent the 2.5 and 97.5 percentiles from 10,000 bootstrap replicates. Statistical significance for the difference between the X chromosome and autosomes was determined with permutation tests (100,000 permutations). (B) Boxplots showing the magnitude of trans-regulatory divergence (abs(log2(species 1/species 2)) − abs(log2(allele 1/allele 2))) for the X chromosome and autosomes for each comparison are shown with the median (center line) as well as 25th and 75th percentiles indicated (box upper and lower bounds) and whiskers extending 1.5× the interquartile range. (C) The magnitude of trans-regulatory divergence scaled by total regulatory divergence ([|trans|/(|cis|+|trans|)] × 100, %trans) was determined and boxplots with the median (center line) as well as 25th and 75th percentiles indicated (box upper and lower bounds) and whiskers extending 1.5× the interquartile range. (B, C) Statistical significance of differences between X and autosome was determined using Mann–Whitney U tests. (D) The proportion of genes with significant trans-regulatory differences for each comparison is shown and error bars represent the 2.5 and 97.5 percentiles from bootstrapping 10,000 times. Statistical significance of the difference between the X chromosome and autosomes was determined with Fisher’s exact tests (NS indicates not significant, *P ≤ 0.05, **P ≤ 0.001, and ***P ≤ 1 × 10⁻⁴).
