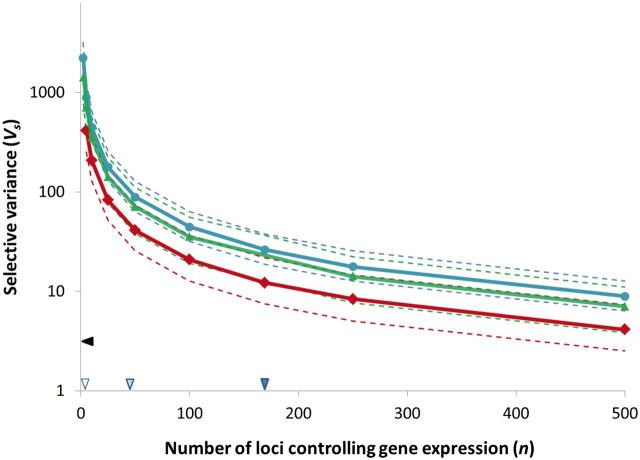
Fig. 3.
The influence of the number of loci controlling gene expression (n) on the genome-wide strength of selection. The median genome-wide Vs based on the HC model is plotted on the y axis based on values of n drawn from exponential distributions with means represented on the x axis for yeast genes (blue circles, 3,412 genes), fruit fly genes (green triangles, 4,950 genes), and nematode genes (red squares, 930 genes). Dotted lines represent the quartiles across all genes analyzed. Triangles on the x axis represent three empirical estimates for n (see table 2). The triangle on the y axis represents the median magnitude of stabilizing selection inferred on morphological and phenological traits for data reanalyzed from Kingsolver and Diamond (2011).

