
Figure 1.
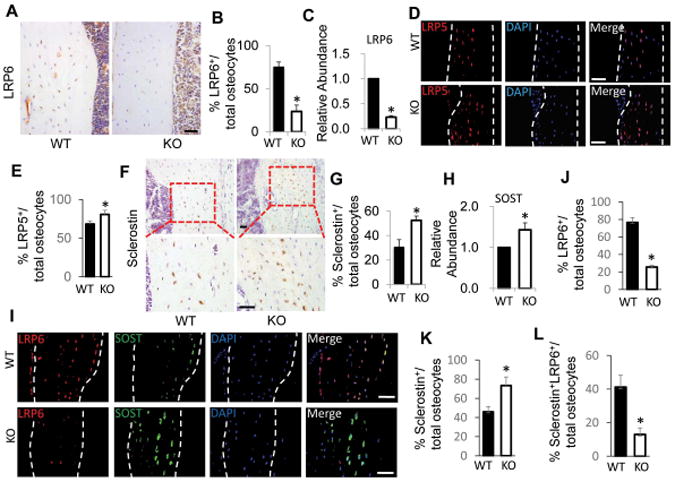
Osteocytes in femur tissue of Oc-Cre–mediated conditional LRP6-deficient mice had increased Sost/sclerostin expression. (A and B) Immunohistochemical analysis of LRP6 expression in cortical bone of femur from 3 month-old male Oc-Cre;Lrp6f/f (KO) and Cre−/−;Lrp6f/f (WT) mice. Representative images of immunohistochemical staining with an antibody to LRP6 (brown), A. Scale bars: 50μm. Quantification of LRP6+ osteocytes out of total osteocytes, B. (C) qRT-PCR analysis of Lrp6 expression in cortical bone extracts from 3-month-old male WT and KO mice. (D and E) Immunofluorescence staining of LRP5 in cortical bone of femur from 3 month-old male WT and KO mice. Representative images, D, and quantification of LRP5-positive osteocytes out of total osteocytes, E, are shown. Scale bars: 50μm. (F and G) Immunohistochemical analysis of sclerostin expression in cortical bone of femur from 3 month-old male WT and KO mice. Representative images of immunohistochemical staining with an antibody to sclerostin (brown) in low power (F, upper panels) and high power (F, bottom panels). Scale bars: 50μm. Quantification of sclerostin+ osteocytes out of total osteocytes, G. (H) qRT-PCR analysis of Sost expression in cortical bone extracts from 3-month-old male WT and KO mice. (I–L) Double-immunofluorescence staining of LRP6 and sclerostin in cortical bone of femur from 3 month-old male WT and KO mice. Representative images, I, and quantification of LRP6+, J, sclerostin+, K, and LRP6+sclerostin+, L, osteocytes out of total osteocytes were shown. Scale bars: 50μm. For all the experiments, a total of three femur sections from each mouse, and six mice per treatment group were analyzed. *P < 0.01 vs. WT mice.