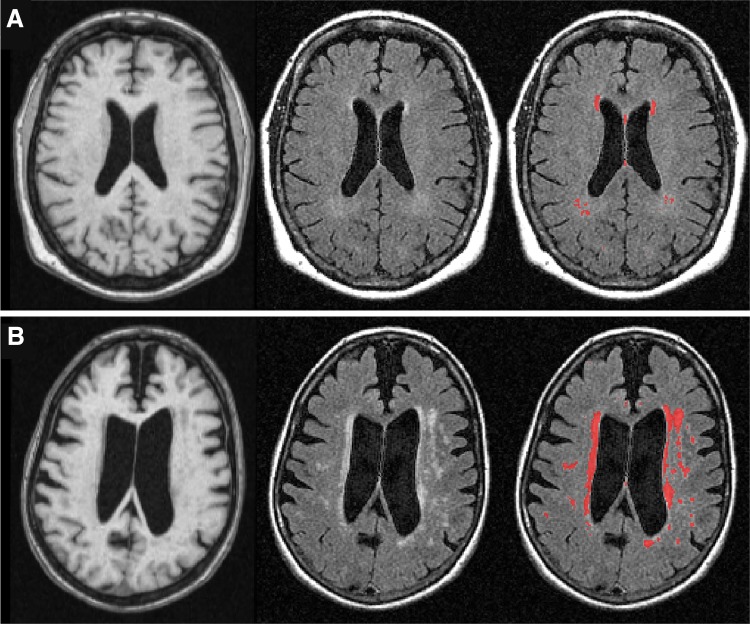
Fig. 1.
Brain MRI images from two individuals, one with small (a), and one with large (b) total WMH volume. Top row (a) shows one individual with small (25 %) total WMH volume, and bottom row (b) shows another individual with large (75 %) total WMH volume. The left column shows averaged T 1-weighted MPRAGE images reformatted from sagittal to axial plane, the middle column shows raw axial T 2-weighted FLAIR images, and the right column shows in red the corresponding WMH lesions segmented automatically based on T 1- and T 2-weighted signals

