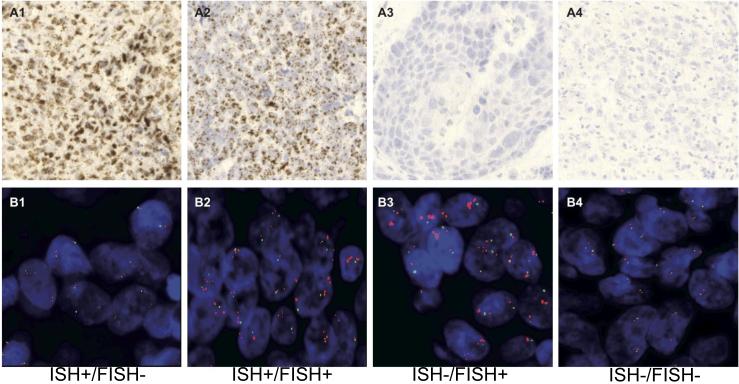
Figure 3. Representative HNSCC tumors positive and negative for FGFR1 GCN and mRNA levels.
Representative ISH staining (A1-A4) and FISH staining (B1-B4) of HNSCC tumors exhibiting increased FGFR1 mRNA, but not GCN (A1, B1), increased FGFR1 mRNA and GCN (A2, B2), increased FGFR1 GCN, but not mRNA (A3, B3) and a tumor with diploid FGFR1 GCN and negative for mRNA (A4, B4).

