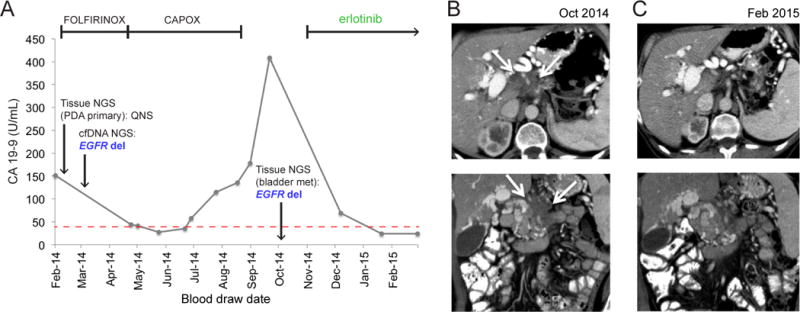
Figure 3.

Treatment and diagnosis history, and response to targeted therapy, of a pancreatic adenocarcinoma patient with an EGFR exon19 deletion. (A) CA 19–9 levels (x axis) over time of treatment (y-axis) for patient #34. Dates of two biopsy-based NGS tests, and of EGFR indel detection by cfDNA test, are indicated along the CA 19–9 line. Time intervals for therapies administered to patient are indicated by bracketed lines at top. Erlotinib monotherapy is ongoing as of June 3, 2015. (B) Axial (top) and coronal (bottom) contrast-enhanced CT images from October 2014 demonstrate infiltrative tumor (arrows) arising from the pancreatic body and encasing the celiac axis. (D) Axial (top) and coronal (bottom) contrast-enhanced CT images from February 2015 demonstrate marked reduction in the size of the pancreatic mass.
