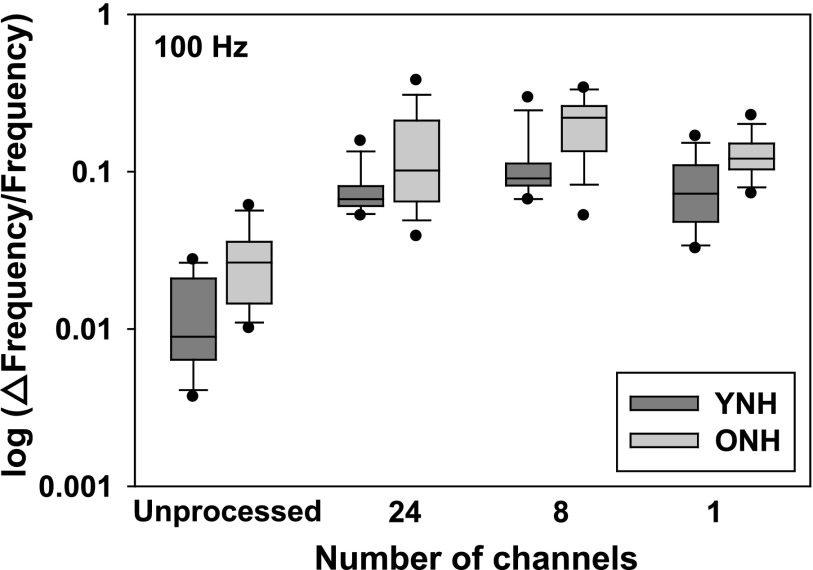
FIG. 3.
Results of the fundamental frequency (f0) discrimination task (Reference = 100 Hz) representing data obtained in younger and older listeners. The abscissa represents the degree of spectral degradation/number of channels, whereas the ordinate represents the discrimination threshold in Weber fraction (Δf0/reference f0 × 100) on a log scale. For each box plot shown, the bottom of the shaded area represents the 25th percentile, a line within the box marks the median, and the top of the shaded area indicates the 75th percentile. Whiskers (error bars) above and below the box indicate the 90th and 10th percentiles. Individual data points show outliers, above and below the 90th and 10th percentiles, respectively. The results of younger participants (darker gray shaded boxes) are shown in comparison to the older participants (lighter shaded boxes).

