
Figure 2.
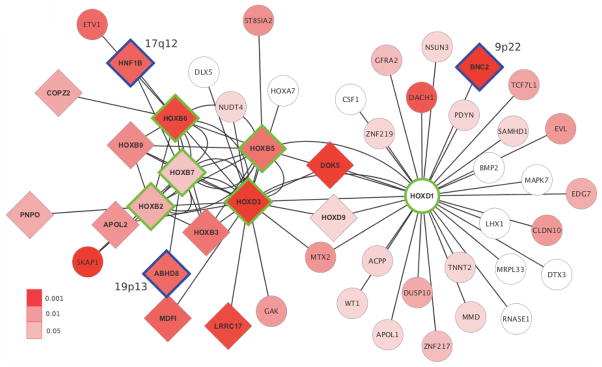
Cytoscape visualization of the combined network. Hub TF genes of the six significant networks underlying the combined network are outlined in green. Candidate genes at genome-wide significant risk loci other than the input hub loci (2q31 and 17q21.32) are outlined in blue. Nodes are colored according to the P-value of the most significant intragenic SNP in the GWAS meta-analysis (uncorrected for the number of intragenic SNPs). Diamond shaped genes have P < 0.05 after applying the modified Sidak correction.